This report contains the collective views of an international group of experts and does not necessarily represent the decisions or the stated policy of the United Nations Environment Programme, the International Labour Organization, or the World Health Organization.
Concise International Chemical Assessment Document 62
First draft prepared by Drs Christine Melber, Janet Kielhorn, and Inge Mangelsdorf, Fraunhofer Institute of Toxicology and Experimental Medicine, Hanover, Germany
Published under the joint sponsorship of the United Nations Environment Programme, the International Labour Organization, and the World Health Organization, and produced within the framework of the Inter-Organization Programme for the Sound Management of Chemicals.
World Health Organization
Geneva, 2004
The International Programme on Chemical Safety (IPCS), established in 1980, is a joint venture of the United Nations Environment Programme (UNEP), the International Labour Organization (ILO), and the World Health Organization (WHO). The overall objectives of the IPCS are to establish the scientific basis for assessment of the risk to human health and the environment from exposure to chemicals, through international peer review processes, as a prerequisite for the promotion of chemical safety, and to provide technical assistance in strengthening national capacities for the sound management of chemicals.
The Inter-Organization Programme for the Sound Management of Chemicals (IOMC) was established in 1995 by UNEP, ILO, the Food and Agriculture Organization of the United Nations, WHO, the United Nations Industrial Development Organization, the United Nations Institute for Training and Research, and the Organisation for Economic Co-operation and Development (Participating Organizations), following recommendations made by the 1992 UN Conference on Environment and Development to strengthen cooperation and increase coordination in the field of chemical safety. The purpose of the IOMC is to promote coordination of the policies and activities pursued by the Participating Organizations, jointly or separately, to achieve the sound management of chemicals in relation to human health and the environment.
WHO Library Cataloguing-in-Publication Data
Coal tar creosote.
(Concise international chemical assessment document ; 62)
1.Coal tar - toxicity 2.Creosote - toxicity 3.Risk assessment 4.Environmental
exposure 5.Occupational exposure I.International Programme on Chemical Safety
II.Series
ISBN 92 4 153062 6 (LC/NLM Classification: QV 633)
ISSN 1020-6167
©World Health Organization 2004
All rights reserved. Publications of the World Health Organization can be obtained from Marketing and Dissemination, World Health Organization, 20 Avenue Appia, 1211 Geneva 27, Switzerland (tel: +41 22 791 2476; fax: +41 22 791 4857; email: bookorders@who.int). Requests for permission to reproduce or translate WHO publications — whether for sale or for noncommercial distribution — should be addressed to Publications, at the above address (fax: +41 22 791 4806; email: permissions@who.int).
The designations employed and the presentation of the material in this publication do not imply the expression of any opinion whatsoever on the part of the World Health Organization concerning the legal status of any country, territory, city or area or of its authorities, or concerning the delimitation of its frontiers or boundaries. Dotted lines on maps represent approximate border lines for which there may not yet be full agreement.
The mention of specific companies or of certain manufacturers’ products does not imply that they are endorsed or recommended by the World Health Organization in preference to others of a similar nature that are not mentioned. Errors and omissions excepted, the names of proprietary products are distinguished by initial capital letters.
The World Health Organization does not warrant that the information contained in this publication is complete and correct and shall not be liable for any damages incurred as a result of its use.
Risk assessment activities of the International Programme on Chemical Safety, including the production of Concise International Chemical Assessment Documents, are supported financially by the Department of Health and Department for Environment, Food & Rural Affairs, UK, Environmental Protection Agency, Food and Drug Administration, and National Institute of Environmental Health Sciences, USA, European Commission, German Federal Ministry of Environment, Nature Conservation and Nuclear Safety, Health Canada, Japanese Ministry of Health, Labour and Welfare, and the Swiss Agency for Environment, Forests and Landscape.
Technically and linguistically edited by Marla Sheffer, Ottawa, Canada, and printed by Wissenchaftliche Verlagsgesellschaft mbH, Stuttgart, Germany
Concise International Chemical Assessment Documents (CICADs) are the latest in a family of publications from the International Programme on Chemical Safety (IPCS) — a cooperative programme of the World Health Organization (WHO), the International Labour Organization (ILO), and the United Nations Environment Programme (UNEP). CICADs join the Environmental Health Criteria documents (EHCs) as authoritative documents on the risk assessment of chemicals.
International Chemical Safety Cards on the relevant chemical(s) are attached at the end of the CICAD, to provide the reader with concise information on the protection of human health and on emergency action. They are produced in a separate peer-reviewed procedure at IPCS. They may be complemented by information from IPCS Poison Information Monographs (PIM), similarly produced separately from the CICAD process.
CICADs are concise documents that provide summaries of the relevant scientific information concerning the potential effects of chemicals upon human health and/or the environment. They are usually based on selected national or regional evaluation documents or on existing EHCs. Before acceptance for publication as CICADs by IPCS, these documents undergo extensive peer review by internationally selected experts to ensure their completeness, accuracy in the way in which the original data are represented, and the validity of the conclusions drawn.
The primary objective of CICADs is characterization of hazard and dose–response from exposure to a chemical. CICADs are not a summary of all available data on a particular chemical; rather, they include only that information considered critical for characterization of the risk posed by the chemical. The critical studies are, however, presented in sufficient detail to support the conclusions drawn. For additional information, the reader should consult the identified source documents upon which the CICAD has been based.
Risks to human health and the environment will vary considerably depending upon the type and extent of exposure. Responsible authorities are strongly encouraged to characterize risk on the basis of locally measured or predicted exposure scenarios. To assist the reader, examples of exposure estimation and risk characterization are provided in CICADs, whenever possible. These examples cannot be considered as representing all possible exposure situations, but are provided as guidance only. The reader is referred to EHC 170.1
While every effort is made to ensure that CICADs represent the current status of knowledge, new information is being developed constantly. Unless otherwise stated, CICADs are based on a search of the scientific literature to the date shown in the executive summary. In the event that a reader becomes aware of new information that would change the conclusions drawn in a CICAD, the reader is requested to contact IPCS to inform it of the new information.
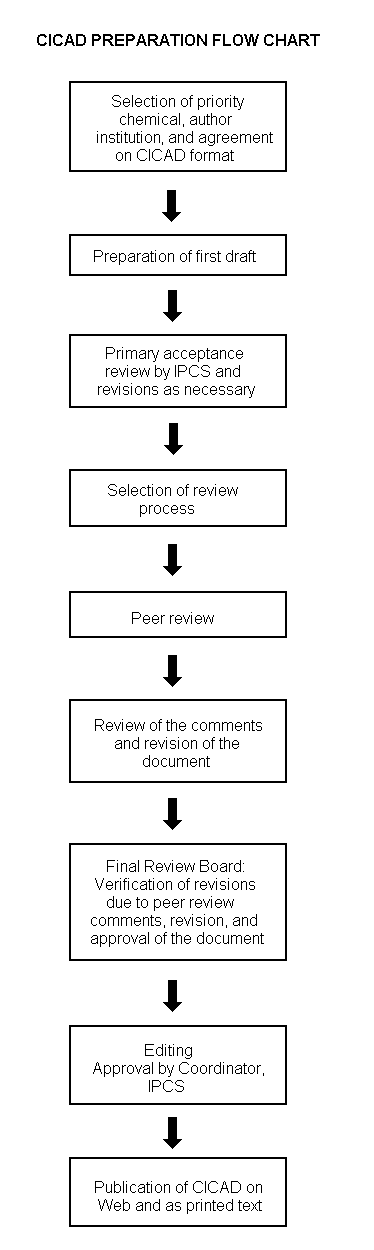
Procedures
The flow chart on page 2 shows the procedures followed to produce a CICAD. These procedures are designed to take advantage of the expertise that exists around the world — expertise that is required to produce the high-quality evaluations of toxicological, exposure, and other data that are necessary for assessing risks to human health and/or the environment. The IPCS Risk Assessment Steering Group advises the Coordinator, IPCS, on the selection of chemicals for an IPCS risk assessment based on the following criteria:
Thus, it is typical of a priority chemical that
|
Advice from Risk Assessment Steering Group Criteria of priority:
Thus, it is typical of a priority chemical that
Special emphasis is placed on avoiding duplication of effort by WHO and other international organizations. A prerequisite of the production of a CICAD is the availability of a recent high-quality national/regional risk assessment document = source document. The source document and the CICAD may be produced in parallel. If the source document does not contain an environmental section, this may be produced de novo, provided it is not controversial. If no source document is available, IPCS may produce a de novo risk assessment document if the cost is justified. Depending on the complexity and extent of controversy of the issues involved, the steering group may advise on different levels of peer review:
|
The Steering Group will also advise IPCS on the appropriate form of the document (i.e., a standard CICAD or a de novo CICAD) and which institution bears the responsibility of the document production, as well as on the type and extent of the international peer review.
The first draft is usually based on an existing national, regional, or international review. When no appropriate source document is available, a CICAD may be produced de novo. Authors of the first draft are usually, but not necessarily, from the institution that developed the original review. A standard outline has been developed to encourage consistency in form. The first draft undergoes primary review by IPCS to ensure that it meets the specified criteria for CICADs.
The second stage involves international peer review by scientists known for their particular expertise and by scientists selected from an international roster compiled by IPCS through recommendations from IPCS national Contact Points and from IPCS Participating Institutions. Adequate time is allowed for the selected experts to undertake a thorough review. Authors are required to take reviewers’ comments into account and revise their draft, if necessary. The resulting second draft is submitted to a Final Review Board together with the reviewers’ comments. At any stage in the international review process, a consultative group may be necessary to address specific areas of the science. When a CICAD is prepared de novo, a consultative group is normally convened.
The CICAD Final Review Board has several important functions:
Board members serve in their personal capacity, not as representatives of any organization, government, or industry. They are selected because of their expertise in human and environmental toxicology or because of their experience in the regulation of chemicals. Boards are chosen according to the range of expertise required for a meeting and the need for balanced geographic representation.
Board members, authors, reviewers, consultants, and advisers who participate in the preparation of a CICAD are required to declare any real or potential conflict of interest in relation to the subjects under discussion at any stage of the process. Representatives of nongovernmental organizations may be invited to observe the proceedings of the Final Review Board. Observers may participate in Board discussions only at the invitation of the Chairperson, and they may not participate in the final decision-making process.
The first draft of this CICAD was prepared by the Fraunhofer Institute of Toxicology and Experimental Medicine, Hanover.2 A comprehensive literature search of relevant databases was performed in June 2002. The first draft of this document was circulated for a limited peer review, and a Consultative Group was convened to finalize the document and verify that the peer review comments had been adequately dealt with. The members of the Consultative Group, who were participants in this peer review, are provided in Appendix 2. The final draft was then sent for peer review to IPCS Contact Points and Participating Institutions, as well as to further experts identified in collaboration with the IPCS Risk Assessment Steering Group. Information on the peer review of this CICAD is presented in Appendix 3. This CICAD was approved as an international assessment at a meeting of the Final Review Board, held in Varna, Bulgaria, on 8–11 September 2003. The members of the Final Review Board are listed in Appendix 4. The International Chemical Safety Card for creosote (ICSC 0572), produced by the International Programme on Chemical Safety (IPCS, 2002), has also been reproduced in this document.
This CICAD is on coal tar creosote. Wood creosote is a different product that is used mainly in pharmaceutical preparations and is not covered in this document.
Coal tar creosote is a brownish-black/yellowish-dark green oily liquid with a characteristic odour, obtained by the fractional distillation of crude coal tars. The approximate distillation range is 200–400 °C. The chemical composition of creosote is influenced by the origin of the coal and also by the nature of the distilling process; as a result, the creosote components are rarely consistent in their type and concentration.
Creosote is a mixture of several hundred, probably a thousand, chemicals, but only a limited number of them are present in amounts greater than 1%. There are six major classes of compounds in creosote: aromatic hydrocarbons, including polycyclic aromatic hydrocarbons (PAHs) and alkylated PAHs (which can constitute up to 90% of creosote); tar acids / phenolics; tar bases / nitrogen-containing heterocycles; aromatic amines; sulfur-containing heterocycles; and oxygen-containing heterocycles, including dibenzofurans. Creosote may be sold as diluted preparations, which may contain carrier oil or solvents. The composition and use of creosote are regulated in some countries; the regulations usually focus on the content of benzo[a]pyrene (BaP) and phenolics.
Creosote is only slightly soluble in water and soluble in a variety of organic solvents. However, the physical and chemical properties of the individual components of creosote vary widely; some, for example, are highly soluble in water.
The analysis of creosote is complex. Different profiles of creosote chemicals are found in the different matrices: the most volatile are found in air, the most soluble in water, and those with greater sorptive capacity in sediment/soil. Depending upon the matrix (e.g., air, water, soil/sediment, biological materials) from which the sample is taken, suitable cleanup and extraction are necessary. High-resolution gas chromatography (HRGC) with a flame ionization detector (FID) or mass spectrometric (MS) detection or reversed-phase high-performance liquid chromatography (HPLC) with a fluorescence detector (FL) have been the separation and determination methods most commonly used.
Occupational exposure to airborne creosote particles has been previously monitored as coal tar pitch volatiles (CTPV). However, the CTPV method is not sensitive enough to measure low concentrations of creosote fumes. Important components such as airborne PAHs can be sampled on a polytetrafluoroethylene (PTFE) filter connected to a sorbent tube and analysed after extraction by HRGC or HPLC. Other volatile compounds from creosote can be sampled on sorbent tubes.
The urinary PAH metabolites 1-pyrenol (1-hydroxypyrene) and 1-naphthol (1-hydroxynaphthalene) have been used in the assessment of creosote exposure.
Coal tar creosote is a wood preservative and water-proofing agent for structures on land and in marine and fresh waters and for railway crossing timbers and sleepers (railroad ties), bridge and pier decking, poles, log homes, fencing, and equipment for children’s playgrounds.
The majority of creosote used in the European Union (EU) is for the pressure impregnation of wood. In the USA and many other countries, the use of coal tar creosote is limited to certified applicators.
Non-wood uses include anti-fouling applications on concrete marine pilings. Creosote can be a component of roofing pitch, fuel oil, and lamp black and a lubricant for die moulds. Other uses reported include animal and bird repellent, insecticide, animal dip, and fungicide.
Creosote production in the USA falls into two categories: distillate (100%) creosote and creosote in coal tar solution. Distillate production in 1992 was 240 000 tonnes; production of creosote in coal tar solution was 110 000 tonnes. The production of creosote in the EU has been estimated to be approximately 60 000–100 000 tonnes per year.
During pressure impregnation of wood products, excess creosote may be released from the treated materials. Leaching of spilled wastes from these application sites has been common. Creosote is also released to the environment from facilities through air emissions.
The environmental transport and distribution of creosote are complex processes, depending on the physicochemical properties of creosote constituents and their interaction with matrix properties, as well as environmental conditions. Generally, creosote is distributed within all environmental compartments (air, water, sediment, soil, biota). However, the major environmental sinks of creosote components are sediment, soil, and groundwater.
Generally, phenolic compounds, low-molecular-weight PAHs, and some heterocycles tend to be predominantly in the gaseous phase. Creosote constituents may also occur in the atmosphere as particulate matter.
Volatilization of creosote from water surfaces is not considered to be a significant process.
The movement of creosote within aquatic systems is dependent upon the aqueous solubility, affinity to organic phases, and sorptive capacity of the components. Generally, the highly soluble fraction includes phenolic and heterocyclic compounds and low-molecular-weight PAHs. The high-molecular-weight aromatic compounds, with relatively low solubilities and high adsorptive capacities, dominate the associated sediments. However, movement of high-molecular-weight compounds may occur by co-transport of colloid-sorbed contaminants.
Field observations and laboratory leaching experiments have shown losses of creosote components from wooden creosoted constructions during water immersion. Leachability of creosote components was higher in fresh water than in seawater. The rate of migration increased with increasing temperature and decreased with the age of the pilings. Nitrogen-containing heterocycles leached faster than PAHs and dibenzofuran.
The rate of vertical or horizontal transport of creosote components in soil is dependent upon their physicochemical properties as well as the soil properties and environmental conditions. Laboratory model and field experiments (simulating creosote spills) showed a high retardation of transport of high-molecular-weight compounds coupled with a fast downward migration of low-molecular-weight compounds. Some of the creosote compounds released from treated wood products into surrounding soil may persist for decades.
Creosote PAHs are taken up to a small degree by terrestrial plants and animals. No quantitative data on uptake of creosote compounds are available for farm animals. A number of aquatic invertebrates and fish monitored in field and laboratory studies showed significant uptake of creosote-derived PAHs. Transfer to the human food supply is possible via contaminated seafood.
The biodegradability of creosote constituents is variable. Generally, the efficacy of aerobic degradation is greater than that of anaerobic degradation. Phenolic compounds are relatively easily degraded. Within PAHs, degradability appears to be inversely related to the number of aromatic rings. Some heteroaromatic compounds are quickly removed, whereas others are recalcitrant. Biotransformation of creosote components appears to dominate over mineralization. In some cases, the intermediates formed can be more persistent, mobile, or toxic than their parent compounds.
Besides structural features of the chemicals, a number of other factors, such as bioavailability, microbial adaptation, oxygen supply, and nutrient availability, influence their degradation or transformation in situ.
Although little examined, fish appear to metabolize creosote PAHs more rapidly than aquatic invertebrates.
Photochemical transformation seems to be the most important abiotic mechanism by which creosote constituents, such as PAHs and heterocyclic and phenolic compounds, are transformed in the atmosphere and, to a lesser extent, in water and soil. Photo-oxidation prevails over direct photolysis. A study performing irradiation of selected PAHs separately or of the same PAHs present in a creosote mixture showed that there was a trend of decreased photoreactivity in the mixture compared with the individual tests.
Aquatic invertebrates and fish bioaccumulate creosote components, as has been demonstrated mainly for PAHs by field monitoring studies at creosote-contaminated sites, relocation experiments, and laboratory or microcosm studies. Generally, PAH profiles in insects and crayfish were close to that found in sediments, whereas fish had greatly altered ratios for low/high-molecular-weight PAHs. Bioconcentration factors (BCFs) in connection with creosote exposure have rarely been reported. However, BCFs for PAH components from creosote-contaminated sediments have been estimated to range from 0.3 to 73 000.
A number of remediation strategies have been developed, mainly for creosote-contaminated groundwater and soils. Most of the treatments achieved significant reductions for certain substances, but were not or only partially successful in reducing the toxic potential of the treated matrices.
Creosote-treated wood does not decay in the environment, and therefore its disposal is problematic. Creosote-treated wood should not be incinerated under uncontrolled conditions, as toxicants such as PAHs and halogenated dioxins and furans may be produced.
The very few data available for ambient air concentrations refer to concentrations of selected PAHs in the vicinity of creosote facilities. A maximum concentration of 90 ng/m3 has been reported for naphthalene at a distance of 2000 m. Concentrations decreased with increasing distances from creosoting plants: for example, from 64 ng/m3 at 500 m to 1.6 ng/m3 at 5000 m for fluoranthene or from 5 ng/m3 at 100 m to 0.6 ng/m3 at 2000 m for BaP.
Groundwater samples near creosote waste sites in several countries have been found to contain creosote-related PAHs and phenolic, heterocyclic, and BTEX (benzene, toluene, ethylbenzene, and xylene) compounds. Monitoring data from 44 Danish creosote sites showed concentrations (90th percentiles) of 30 µg/litre for BaP and 50 µg/litre for chrysene. Highest concentrations of several individual heterocyclic, phenolic, or BTEX compounds detected in the vicinity of several creosote waste sites were in the range of 10–80 mg/litre.
Concentrations in the mg/litre range have been found for some individual PAHs in river water affected by a creosote spill 10 years earlier. Twelve individual PAHs were monitored in water samples of a drainage stream near a creosote works. Maximum concentrations ranged from 0.02 µg/litre (benzo[b]- and benzo[k]fluoranthene) to 153 µg/litre (naphthalene), with BaP concentrations of up to 0.05 µg/litre.
Elevated PAH concentrations have also been observed in small waterways, where banks were protected with creosoted wood constructions, or in railway ditches, where creosote-treated power or telecommunication line poles were erected. The maximum BaP concentration measured was 2.5 µg/litre. The mean total PAH concentration in the ditches was about 600 µg/litre.
In the vicinity of wood-preserving facilities, maxima for total PAHs in sediments amounted to about 20 000–30 000 mg/kg dry weight; maxima for total nitrogen heterocycles were in the order of 1000 mg/kg dry weight. BaP concentrations as high as several hundred mg/kg dry weight have been measured. The most abundant heterocycle was carbazole (18 mg/kg dry weight). Sediments near creosoted wooden constructions (pilings, bank protection, poles/sleepers) showed total PAH concentrations of up to 1200 mg/kg dry weight, with mean BaP concentrations of about 2 mg/kg dry weight.
Elevated concentrations of creosote-derived compounds have been documented in soils near abandoned creosote-producing/using facilities in several countries, with maximum concentrations of several thousand mg/kg dry weight for total PAHs and of nearly 100 mg/kg for total phenols. Concentrations of "creosote oil contents" up to 90 000 mg/kg dry weight have been reported around creosote-treated poles. Soil from a storage area for impregnated railway ties and playground sand from sandboxes made of old impregnated railway ties contained total PAHs at concentrations up to 20 mg/kg and up to about 2 mg/kg dry weight, respectively. BaP concentrations found in soils near wood treatment/storage sites reached a maximum of 390 mg/kg dry weight, those near creosoted posts, 6 mg/kg, and those from playground sand, 0.2 mg/kg.
Creosoted wood products can contain high concentrations of PAHs, even after several decades of use; phenolic and heterocyclic compounds may also be present. For example, mean concentrations (mg/kg wood) ranging from 1510 (quinoline) to 11 990 (phenanthrene) have been found to occur in creosoted wood. Wooden sleepers installed in playgrounds showed BaP concentrations of up to 1570 mg/kg shavings.
Edible fish and seafood captured from creosote-contaminated areas or held in creosoted cages have been found to contain increased concentrations of PAHs and PAH metabolites. The mean concentration of BaP in tail meat of commercial market lobsters increased from 0.6 to 79 µg/kg wet weight after about 3 months of impoundment.
Creosote-derived PAHs have been detected at concentrations significantly over background levels in several classes of aquatic fauna, including insects, molluscs, crustaceans, and fish collected at various creosote-contaminated sites of freshwater or estuarine/marine environments. In general, concentrations were highest in invertebrates (up to several hundred mg/kg dry weight). Concentrations of total PAHs in liver of fish living on creosote-contaminated sediment and in their invertebrate food organisms were as high as 1 and 84 mg/kg dry weight, respectively (compared with 0.1 and 0.5 mg/kg dry weight in controls). Heterocyclic compounds in snails (Thais haemastoma) from a bay near a wood-preserving facility were found to be present at concentrations up to about 10 µg/kg wet weight, and PAHs were present at concentrations up to about 200 µg/kg wet weight.
The general population can be exposed to creosote or creosote components by handling creosote or products containing creosote and by contact with creosote-contaminated air, water, soil, or food. Routes of exposure include inhalation, drinking/ingestion, and skin contact.
Due to the complexity of creosote and the many different exposure situations, exposure may vary both qualitatively and quantitatively. Nevertheless, some estimations using BaP as a marker substance and based on several assumptions have been performed for two important exposure scenarios. As a result, a daily exposure through skin contact of about 2 ng BaP/kg body weight has been assessed for children playing on creosoted playground equipment. The daily intake of BaP from consumption of vegetables and fruits from gardens in the vicinity of creosoting plants has been estimated to range from 1.4 to 71.4 µg/kg body weight.
There is one study providing internal monitoring data for people living in the vicinity of a creosote impregnation plant. Excretion values of 1- and 2-naphthol were significantly higher in the exposed residents than in controls. For example, the mean concentrations of 1-naphthol in morning urine samples were 2.5 µmol/mol creatinine for the exposed and 1.2 µmol/mol creatinine for the non-exposed group. The 1-pyrenol excretion did not differ significantly.
Occupational exposure to creosote may occur during manufacture, use, transport, or disposal of creosote or creosoted wood products. Most data are available for wood-preserving workers.
Creosote aerosol concentrations monitored as the CTPV by similar methods in wood impregnation plants reached maxima of up to 9700 µg/m3. Total time-weighted average (TWA) concentrations of creosote vapours ranged from 0.5 to 9.1 mg/m3, with peaks up to 71 mg/m3, at wood impregnation plants and from 0.1 to 11 mg/m3 at workplaces where creosoted wood was handled. The mean concentrations of particulate PAHs ranged from 0.2 to 106 µg/m3 in the impregnation plants and from 0.8 to 46 µg/m3 in the handling of impregnated wood. The proportion of particulate-bound PAHs relative to total PAHs appeared to be less than 4%.
Prevailing compounds of the vapour phase of wood impregnation plants were naphthalene, methylnaphthalenes, indene, acenaphthene, and fluorene; the main PAHs of the particulate phase included fluorene, phenanthrene, anthracene, and pyrene. Maximum concentrations of the marker substances naphthalene and BaP (the latter mainly particle-bound) were as high as 41 mg/m3 and 1 µg/m3, respectively. An abundant heterocyclic PAH was benzothiophene, showing concentrations of up to 2800 µg/m3. Concentrations of phenol, biphenyl, and methyl styrenes did not exceed 2000, 1000, and 3000 µg/m3, respectively. Air monitoring during cleanup operations of highly creosote-contaminated soil revealed exposure concentrations of up to 0.9 mg/m3 for volatile PAHs, 0.2 mg/m3 for particulate PAHs, and <0.002 mg/m3 for BaP.
An important route of occupational exposure to creosote is via skin. It has been estimated that over 90% of pyrene and 50–70% of naphthalene enters via the skin. A mean total pyrene contamination on the skin of creosote impregnation workers was approximately 1 mg/day in workers without protective clothing. Protective clothing reduced the pyrene contamination on the workers’ skin by about 35%, on average.
Concentrations of two PAH metabolites, 1-naphthol and 1-pyrenol, have been monitored as internal markers of creosote exposure. For example, the mean urinary concentrations of 1-naphthol in Finnish wood impregnation plant workers and in assemblers handling treated wood were 1350 and 1370 µmol/mol creatinine, respectively. The mean urinary concentration of 1-pyrenol was about 10 times higher in these wood impregnators (64 µmol/mol creatinine) than in the assemblers. An increase in urinary 1-pyrenol values during the workshift has also been observed in workers involved in the production of creosote or the cleanup of creosote-contaminated soil. The 1-pyrenol concentrations correlated well with differences in pyrene skin contamination, but poorly with differences in pyrene breathing-zone air concentrations.
Exposure calculations on the basis of excreted metabolites (plus air and/or skin monitoring data) suggested a total daily uptake of 15 or 16 mg/worker (assembler or impregnator) for naphthalene. Estimations for pyrene did not exceed 5 mg/worker per day.
There are no laboratory animal or human studies measuring the specific rate and extent of coal tar creosote absorption following oral, inhalation, or dermal exposure. However, evidence for a significant absorption of creosote components comes from detection of creosote PAH metabolites in urine of creosote-exposed workers or volunteers and from detection of PAH–DNA adducts in animal or human tissues following creosote exposure. Indirect evidence also comes from the toxic effects elicited by creosote in laboratory animals or humans. Additionally, single-component studies show a significant absorption potential of individual PAHs, although their predictive value for the quantitative absorption kinetics after exposure to the mixture is limited.
Specific distribution studies on coal tar creosote have not been performed.
In accordance with principal PAH metabolic pathways, hydroxy metabolites of PAHs such as 1-naphthol and 1-pyrenol have been measured in urine of creosote-exposed humans.
In general, PAHs (metabolized or unmetabolized) can be excreted into bile, faeces, and urine as well as into breast milk, regardless of the route of absorption. However, specific studies on the elimination and excretion of coal tar creosote are confined to the determination of PAH metabolites in human urine. Elevated urinary levels of 1-naphthol and 1-pyrenol have been found in workers of several wood creosoting plants and in assemblers handling creosote-impregnated wood. Comparisons between the estimated daily uptake of naphthalene/pyrene by inhalation and the urinary excretion of 1-naphthol/1-pyrenol indicated a remarkable contribution of non-inhalation routes of uptake, especially for pyrene. The relevance of dermal uptake for 1-pyrenol excretion has also been demonstrated in workers using protective clothing, which resulted in a significant reduction of skin contamination and 1-pyrenol excretion. Topical treatment of volunteers with a single dose of creosote significantly enhanced the basal excretion of 1-pyrenol.
Elimination half-lives for 1-naphthol and 1-pyrenol were in the range of hours or days.
Most studies on interactions of creosote with cellular components refer to interactions of creosote PAHs with nucleic acids. PAH–DNA adducts have been detected in mice, rats, and fish after experimental or environmental exposure to creosote.
Based on limited studies, creosotes are of low to moderate acute toxicity in experimental animals. The lowest LD50 value, 433 mg/kg body weight, was reported for mice after oral exposure. There is little reliable information on effects of creosotes after short-term exposure. Body weight losses have been observed in rats, sheep, and calves following oral creosote doses.
Some earlier limited studies with mice indicated a carcinogenic activity of creosotes after topical application. Types of tumours included not only skin carcinomas and papillomas, but also lung carcinomas. A more recent epicutaneous mouse study performed with two different coal tar creosote preparations (CTP1: BaP content of 10 mg/kg; CTP2: BaP content of 275 mg/kg) confirmed the carcinogenic potential of creosotes with respect to induction of skin tumours. There was a linear dose–effect relationship between tumour incidence and BaP content of both creosotes. The creosotes were about 5 times more potent than expected from pure BaP treatments. Non-neoplastic effects observed in this long-term (78 weeks) study included skin ulcerations and decreases in life span.
Several creosotes have been shown to be skin irritants in animals. Data on eye irritancy are conflicting.
There are no adequate animal studies on the reproductive or developmental toxicity of creosotes. However, creosote has been shown to be able to elicit estrogen-mediated activities in vitro, indicating some potential for endocrine disruption. Adverse reproductive effects have also been reported in fish exposed to creosote.
A number of in vitro tests based upon bacterial and mammalian systems have shown creosote to be genotoxic. The pattern of genotoxicity observed was similar to that found in PAHs. Creosote was also genotoxic in an in vivo micronucleus test in mice.
Tests with fish cells in culture showed that the cytotoxicity of creosote is enhanced by irradiation with ultraviolet (UV) light. This is consistent with the known phototoxic potential of some PAHs.
Creosote has been shown to be a hepatic microsomal enzyme inducer in laboratory mammals.
Information on the effects of coal tar creosote in the general population is scarce.
Creosote has been involved in incidental or accidental poisoning incidents, mainly due to its use as a pesticide. Deaths occurred following ingestion of about 1–2 g (children) or about 7 g (adults). Symptoms included salivation, vomiting, respiratory difficulties, vertigo, headache, loss of pupillary reflexes, hypothermia, cyanosis, convulsion, etc., accompanied by oropharyngeal, intestinal, pericardial, liver, and kidney damage.
Increased occurrence of skin rashes in people residing in or near an abandoned wood creosoting plant in the USA has been suggested.
Evidence of cancer incidence following environmental exposure is limited to a report on breast and gastrointestinal cancer in females of a population exposed to a creosote-contaminated water supply in the USA. However, it could not clearly be demonstrated whether creosote or confounding risk factors were responsible.
Most reports on the effects of coal tar creosote on humans refer to occupational exposure, resulting mainly from dermal and/or inhalational contact with creosote or creosoted wood.
The most apparent effects included irritations or lesions of skin and eyes, including phototoxic or photoallergic reactions, sometimes accompanied by general symptoms such as depression, weakness, headache, slight confusion, vertigo, nausea, increased salivation, or vomiting. Photosensitization (sensitization of the skin to UV light by creosote) has been observed in workers exposed to creosote.
Increased risks of developing lip and skin cancers have been observed in cohort studies of Swedish and Norwegian wood impregnators and in Finnish round timber workers. The possible interaction with sunlight exposure has not been adequately addressed. The mortality for cancer of the scrotum was elevated among brickmakers exposed to creosote.
Single epidemiological studies suggested a possible risk for bladder cancer, multiple myeloma, and lung cancer due to exposure to creosote. Two case–control studies suggested an increased risk of brain tumours and neuroblastoma among offspring of male workers with possible creosote exposure.
All of the epidemiological studies were based on qualitative estimations of exposure rather than on measurements.
EC50 values (15 min) determined using the Microtox test (inhibition of bioluminescence from Photobacterium phosphoreum or Vibrio fischeri) by different coal tar creosotes (in acetone solutions) ranged from 0.38 to 0.63 mg/litre. Significant decreases in bioluminescence compared with controls have also been found for several creosote-contaminated environmental samples, such as sediments (including their elutriates and pore waters) and groundwater. Furthermore, a strong inhibition of nitrification by creosote-contaminated leachate has been observed.
Creosote induced signs of stress and abnormal growth in experimentally exposed aquatic plants. Visual changes in Myriophyllum spicatum could be seen at nominal creosote concentrations as low as 1.5 mg/litre. EC50 values for a decrease in node production, shoot lengths, and dry weight were calculated to be 86, 55, and 33 mg/litre, respectively. Additionally, membrane ion leakage was significantly and dose-dependently increased at creosote concentrations ranging from 0.1 to 92 mg/litre. The phototoxic potential of creosote has been demonstrated in Lemna gibba: EC50 values (nominal) for reduction in growth rate decreased from 54 mg/litre (under laboratory visible light) to 12 mg/litre under simulated solar radiation.
Creosote EC50/LC50 values for aquatic invertebrates have been measured in the range of 0.02–4.3 mg/litre. Larval stages proved to be more sensitive than adult stages. Lifetime exposure of Daphnia pulex to water-soluble fractions of creosote resulted in decreased growth rates and reproductive impairment.
An increase in susceptibility to infections has been observed in eastern oysters (Crassostrea virginica) exposed to 15% and 30% dilutions of creosote-contaminated sediment. Increased mortalities have been noted in many crustacean species exposed in the laboratory to matrices environmentally contaminated by creosote. Sublethal effects, such as decreases in dry weight gain and in proportion of gravid females, have been recorded in Mysidopsis bahia (crustacean); the 7-day EC50 for these more subtle effects was 0.015 µg total identified aromatic hydrocarbons/litre.
Acetone extracts from creosote-contaminated sediments showed an acute toxicity to Nitocra spinipes (crustacean) comparable to that of creosote.
Creosote is acutely toxic to fish, with the lowest LC50 reported to be 0.7 mg/litre.
Creosote-contaminated groundwater, water, or sediments (including associated waters) have been shown to cause adverse reproductive and developmental effects in fish. The LC50 for hatching success was calculated to be 0.05 mg creosote/litre. LC50 values determined in spot (Leiostomus xanthurus) decreased with increasing duration of exposure to creosote-contaminated sediment during 7–28 days of exposure.
Data on the effects of creosote exposure on terrestrial organisms are limited. A root elongation test of different creosotes with Allium cepa resulted in 96-h EC50 values (for reduction of root length) ranging from 18 to 34 mg/litre. Earthworms (Eisenia foetida) exposed to creosote-contaminated soil (e.g., about 1000 mg total PAHs/kg dry weight) died within a few days.
In the vicinity of creosote sources, adverse effects on aquatic microorganisms, aquatic invertebrates, and fish have been observed, similar to those inducible by creosote in the laboratory. Fish from heavily creosote-contaminated sites (sediments) showed a high prevalence of hepatic and extrahepatic neoplasms, an impaired immune status (reduced macrophage activities), and reproductive impairment.
In a series of outdoor aquatic microcosm studies in which creosote was added, there was a rapid concentration-dependent reduction in zooplankton abundance and number of taxa, with an EC50 (at 5 days) of 45 µg creosote/litre (nominal). In contrast, there was no direct adverse effect on the phytoplankton community. In another test, rainbow trout (Oncorhynchus mykiss) exposed to 100 µl creosote/litre (nominal) died within 3 days. At lower concentrations, immunological alterations developed within 28 days (lowest-observed-effect concentration [LOEC]: 17 µl creosote/litre [nominal]). The creosote-induced immunomodulation was reversible during continual exposure. Concentration-dependent eye damage and an elevated hepatic ethoxyresorufin-O-deethylase (EROD) activity were seen at 3 and 10 µl creosote/litre (nominal).
Field observations on terrestrial organisms refer to fatal cases of suspected creosote poisoning in wildlife (black rhinoceros Diceros bicornis) and farm animals that had access mainly to freshly creosoted wood or creosote containers.
Creosote is a genotoxic carcinogen for which a threshold has not been identified. There is consistent evidence from human studies that creosote causes skin cancer, but the studies do not allow dose–response analysis.
A study examining skin carcinogenicity of two samples of coal tar creosote, with different BaP contents, and of BaP alone in mice showed a significant increase in the rate of formation of papillomas and squamous cell carcinomas at the site of application. However, other organs were not examined. A linear relationship was observed between tumour rate and the dose of BaP in the creosote solution applied to the skin. There was no evidence of a threshold for carcinogenic effects. Analysis of the dose–response relationship resulted in a slope factor of 4.9 × 10⁻³ tumours/animal for a total dose of 1 µg BaP. In this study, based on its BaP content, creosote appeared to be about 5 times more carcinogenic than a solution of BaP alone.
The human monitoring data concerning this type of exposure are limited; therefore, a sample risk assessment was not included here.
Creosote has been measured in air, water, soil, sediment, and biota. The fate of creosote components is largely dependent on the physicochemical properties of the components, matrix properties, the presence of degrading or accumulating organisms, and environmental conditions. Creosote may pose a significant risk to biota encountering spills or loading events. Laboratory studies have shown toxicity of creosote to aquatic and terrestrial organisms, while field studies have also demonstrated adverse effects following exposure to creosote. To date, it is not clear which creosote components may serve as indicators of environmental creosote contamination and toxicity.
This document is on coal tar creosote. Wood creosote is a different product that is used mainly in pharmaceutical preparations and is not covered in this document.
Coal tar creosote is a brownish-black/yellowish-dark green oily liquid with a characteristic sharp odour, obtained by the fractional distillation of crude coal tars (see Figure 1). The approximate distillation range is 200–400 °C (ITC, 1990). Table 1 provides some of the physical properties of creosote.
Table 1: Physical properties of creosote.a
|
Property |
Value |
|
Synonyms |
Coal tar creosote, creosote oil, coal tar oil, creosote P1 |
|
CAS Nos. |
|
|
Molecular mass |
Variable (complex mixture of hydrocarbons) |
|
Boiling range |
~200–400 °C |
|
Density |
1.00–1.17 g/cm3 at 25 °C |
|
Viscosity |
4–14 mm2/s at 40 °C |
|
Flash point |
Above 66 °C |
|
Ignition temperature |
500 °C |
|
Octanol/water partition coefficient (log Kow) |
1.0 |
|
Solubility in organic solvents |
Miscible with many organic solvents |
|
Solubility in water |
Slightly soluble / immiscible |
a From ITC (1990); von Burg & Stout (1992).
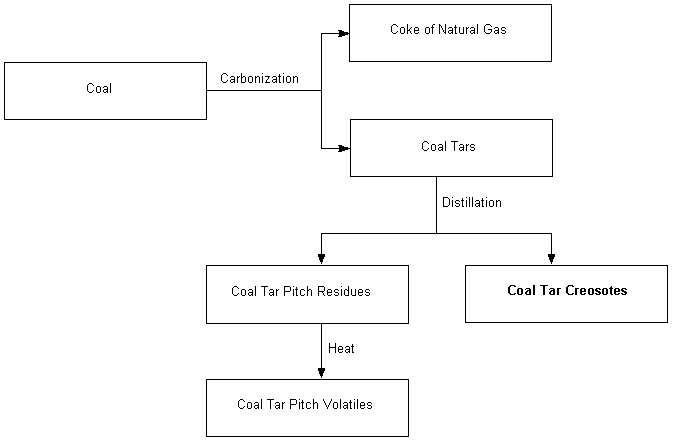
Fig. 1: The formation of creosote from coal tar distillation.
The chemical composition of creosotes is influenced by the origin of the coal and also by the nature of the distilling process; as a result, the creosote components are rarely consistent in their type and concentration. Therefore, the trade names and/or the manufacturers of the creosotes mentioned in this document have been specified, wherever possible.
The legislation concerning the composition of creosote varies from country to country. Creosotes used in wood preservation are classified according to national/ international standards in terms of specifications — e.g., American Wood-Preservers’ Association (AWPA) standards P1 and P2 and the Western European Institute for Wood Preservation creosote grades A, B, and C (see Table 2). For example, before 1994, creosote could contain up to 20% phenolic compounds; in 1994, however, this was limited to 3% (EC, 1994). Further, in recent years, legislation in many countries has required that the BaP content of creosote be reduced. The EU (European Committee for Standardization, 2000) has recently finalized a new standard on classification and methods of testing for creosotes. European industry uses only creosote grades B and C with a BaP content lower than 50 mg/kg (0.005 weight %) and, for grade C, also lower volatile compounds (European Committee for Standardization, 2000).
Table 2: Specifications for creosote (according to the Western European Institute for Wood Preservation).a
|
Grade A |
Grade Bb |
Grade C |
|
|
Boiling range (°C) |
200–400 |
235–400 |
300–400 |
|
Relative density (g/ml) |
1.04–1.15 |
1.02–1.15 |
1.03–1.17 |
|
Flash point (°C) |
>61 |
>61 |
>61 |
|
Crystallization temperature (°C) |
<23c |
<23 |
<50 |
|
Water content (weight %) |
<1 |
<1 |
<1 |
|
Water-extractable phenols (%) |
<3 |
<3 |
<3 |
|
Toluol-insoluble matter (%) |
<0.4 |
<0.4 |
<0.4 |
|
Distillation fractions (weight %) |
|||
|
<235 °C |
<10 |
<20 |
– |
|
<300 °C |
20–40 |
40–60 |
<10 |
|
<355 °C |
55–75 |
70–90 |
65–95 |
|
Benzo[a]pyrene content (%) |
<0.05 (500 mg/kg) |
<0.005 (50 mg/kg) |
<0.005 (50 mg/kg) |
|
a |
From European Committee for Standardization (2000). |
|
b |
The contents of naphthalene and its alkyl homologues are low. |
|
c |
The crystallization points for two coal tar oil samples from Rütgers-VfT AG used in the Fraunhofer study (Buschmann et al., 1997; see section 7) were 1 and 5 °C. |
Creosote is a mixture of several hundred, probably a thousand, chemicals, but only a limited number of them — less than 20% — are present in amounts greater than 1% (Lorenz & Gjovik, 1972; Nylund et al., 1992). The chemical structures of some of these constituents are given in Figure 2.
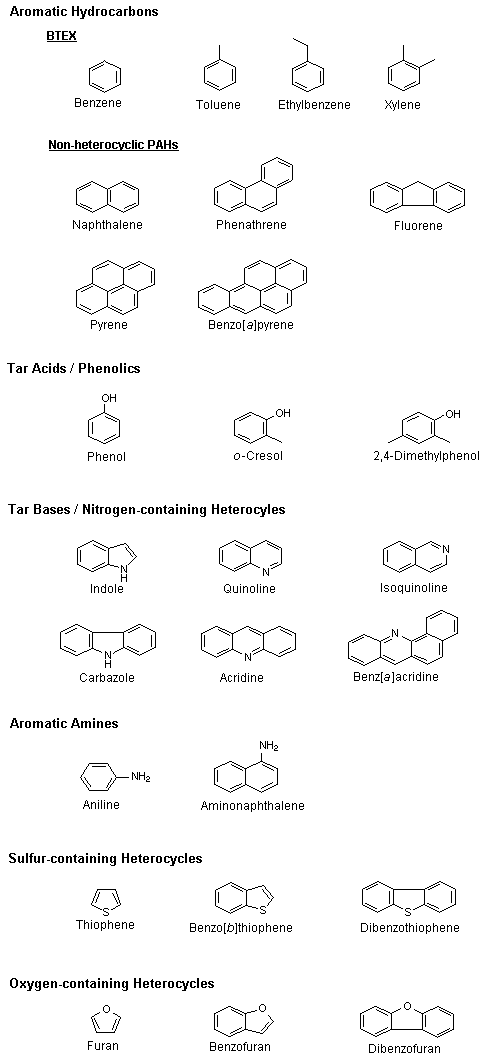
Fig. 2: Chemical structures of some creosote constituents.
There are six major classes of compounds in creosote (Willeitner & Dieter, 1984; US EPA, 1987) (see Table 3):
Table 3: Reported chemical analyses of some coal tar creosotes.a,b
|
Chemical analysis (weight %) |
||||||||
|
(A) |
(B) |
(C) |
(D) |
(E) |
(F) |
(G) |
(H) |
|
|
Aromatic hydrocarbons |
||||||||
|
Indene |
0.6 |
0.43 |
0.87 |
|||||
|
Biphenyl |
0.8*/1.6 |
2.1 |
1–4 |
0.8c |
1.3 |
1.45 |
4.1 |
|
|
PAHs |
||||||||
|
Naphthalene |
1.3/3.0* |
11 |
13–18 |
7.6 |
12.9 |
12.32 |
11.4 |
|
|
1-Methylnaphthalene |
0.9*/1.7 |
12–17 |
0.9c |
2.2 |
3.29 |
8.87 |
||
|
2-Methylnaphthalene |
1.2*/2.8 |
3.0 |
12.0 |
2.1c |
4.5 |
7.51 |
11.5 |
|
|
Dimethylnaphthalenes |
2.0*/2.3 |
5.6 |
1.6 |
3.42 |
5.16 |
|||
|
Acenaphthylene |
0.2 |
0.15 |
0.1 |
|||||
|
Acenaphthene |
9.0*/14.7 |
3.1 |
9.0 |
8.3c |
5.8 |
12.51 |
5.86 |
|
|
Fluorene |
7.3/10.0* |
3.1 |
7–9 |
5.2c |
4.6 |
5.03 |
6.33 |
|
|
Methylfluorenes |
2.3/3.0* |
3.1 |
||||||
|
Phenanthrene |
21* |
12.2 |
12–16 |
16.9c |
11.2 |
10.21 |
6.7 |
1–3.3 |
|
Methylphenanthrenes |
3.0* |
3.1 |
0.45 |
0.54 |
||||
|
Anthracene |
2.0* |
2–7 |
8.2d |
1.7 |
0.9 |
0.8 |
0.4–1.2 |
|
|
Methylanthracenes |
4.0* |
5.9 |
||||||
|
Fluoranthene |
7.6/10.0* |
3.4 |
2–3 |
7.5c |
4.6 |
4.41 |
2.27 |
0.2–2.2 |
|
Pyrene |
7.0/8.5* |
2.2 |
1–5 |
5.3c |
3.7 |
2.0 |
1.13 |
0.1–1.5 |
|
Benzofluorenes |
1.0/2.0* |
3.4 |
2.2 |
|||||
|
Benz[a]anthracene |
0.5 |
0.26 |
0.17 |
|||||
|
Benzo[k]fluoranthene |
0.22 |
0.16–0.3 |
||||||
|
Chrysene |
2.6/3.0* |
2.2 |
1e |
0.5–1.0 |
0.21 |
< 0.05 |
||
|
Benzo[a]pyrene |
0.43c |
0.2 |
<0.1 |
<0.05 |
0.02–0.16 |
|||
|
Benzo[e]pyrene |
0.2 |
|||||||
|
Perylene |
0.1 |
|||||||
|
Tar acids / phenolics |
||||||||
|
Phenol |
0.24 |
0.56 |
0.24 |
|||||
|
o-Cresol |
0.10 |
0.2 |
||||||
|
m-, p-Cresol |
0.24 |
2.31 |
0.6 |
|||||
|
2,4-Dimethylphenol |
0.12 |
0.59 |
0.48 |
|||||
|
Naphthols |
0.12 |
|||||||
|
Tar bases / nitrogen-containing heterocycles |
||||||||
|
Indole |
2d |
|||||||
|
Quinoline |
1 |
2.0d |
0.59 |
0.58 |
0.89 |
|||
|
Isoquinoline |
0.7d |
0.18 |
0.30 |
0.59 |
||||
|
Benzoquinoline |
4d |
0.29 |
0.05 |
0.5 |
||||
|
Methylbenzoquinoline |
0.3d |
|||||||
|
Carbazole |
2.4 |
3.9d |
0.7 |
0.53 |
0.22 |
|||
|
Methylcarbazoles |
2d |
|||||||
|
Benzocarbazoles |
2.8d |
0.1 |
||||||
|
Dibenzocarbazoles |
3.1d |
|||||||
|
Acridine |
2d |
0.2 |
1.5 |
0.12 |
||||
|
Aromatic amines |
||||||||
|
Aniline |
0.05d |
0.21 |
||||||
|
Sulfur-containing heterocycles |
||||||||
|
Benzothiophene |
0.3c |
0.4 |
0.3 |
0.5 |
||||
|
Dibenzothiophene |
1.0 |
0.78 |
0.73 |
|||||
|
Oxygen-containing heterocycles / furans |
||||||||
|
Benzofuran |
< 0.1 |
< 0.1 |
||||||
|
Dibenzofuran |
5.0*/7.5 |
1.1 |
4–6 |
3.9c |
3.7 |
6.14 |
5.59 |
|
|
Other not specified components |
23.1 |
|||||||
|
a |
Adapted from Heikkilä (2001). |
|
b |
(A) Lorenz & Gjovik (1972); with asterisk (*) from a literature survey; without asterisk, own measurements of main components in an AWPA standard creosote. |
|
(B) Nestler (1974); six creosotes, four unspecified, and two fulfilled the US federal specifications I and III. |
|
|
(C) Andersson et al. (1983); Rudling & Rosen (1983); creosote used in the impregnation of railway ties. |
|
|
(D) Wright et al. (1985). |
|
|
(E) ITC (1990); AWPA standard creosote P1 (AWPA P1). |
|
|
(F) Nylund et al. (1992); sample of German creosote; about 85 compounds were identified. |
|
|
(G) Nylund et al. (1992); sample of former Soviet creosote; about 85 compounds were identified. |
|
|
(H) Schirmberg (1980); three different creosote samples, all fulfilling the British standard BS 144/73/2. |
|
|
c |
Concentration in PAH fraction. |
|
d |
Concentration in nitrogen compound fraction. |
|
e |
Includes triphenylene. |
Nylund et al. (1992) analysed four different creosotes from Poland, Germany, Denmark, and the former Soviet Union. They could identify about 85 components (96–98% of the total amount). The main components in all four creosotes were naphthalene and its alkyl derivatives, phenanthrene, fluorene, acenaphthene, alkylphenols, and dibenzofuran. The sum concentration of PAHs with 2–3 aromatic rings was about the same in all four analysed creosotes, but there were considerable differences (1.3–8.6%) in the content of PAHs with >4 aromatic rings (Nylund et al., 1992). An analysis of the PAHs in a mixture of German and Polish creosotes showed that phenanthrene was by far the predominant PAH, followed by naphthalene (Lehto et al., 2000).
Table 3 gives the results of some coal tar creosote analyses, and Table 4 lists the PAH content of some coal tar creosotes used in regulatory monitoring and in some environmental/toxicological studies. Many of the earlier studies on creosote concentrated on PAHs, because they are known carcinogens and represent the largest chemical group in creosote itself. However, PAHs are not very soluble and have a high adsorption to particulate matter. More recent studies (e.g., Arvin & Flyvbjerg, 1992; Mueller et al., 1993; Middaugh et al., 1994a,b) have concentrated on the other compounds in creosote — e.g., BTEX, nitrogen-containing heterocycles, sulfur-containing heterocycles, or phenolics — that are more soluble in water (see Table 5) and are found at a much higher percentage in leachate, contaminated water, soil, and sediment (see section 5). Heterocyclic compounds constitute about 5% of creosote compounds; however, due to their relatively high solubility and weak sorption, they can amount to 35–40% of the water-soluble fraction of creosote and are therefore potential groundwater contaminants (Licht et al., 1996). The mixture profiles of creosote-associated chemicals found in the environment (see section 5) are quite different from those in Table 3.
Table 4: Priority PAHs and concentration of PAHs in some creosotes used in environmental/toxicological studies.
|
PAH |
Priority PAHsa |
PAH concentrations (weight %) |
|||
|
Lehto et al. (2000) |
Bestari et al. (1998a); Fielden et al. (2000) |
CTP1b; Mangelsdorf et al. (1998) |
CTP2b; |
||
|
Naphthalene |
* N |
5.04 |
7.4 |
12.3 |
2.4 |
|
Acenaphthylene |
* |
0.02 |
n.g.c |
n.g. |
n.g. |
|
Acenaphthene |
* |
2.42 |
3.8 |
n.g. |
n.g. |
|
Fluorene |
* |
3.60 |
2.1 |
n.g. |
n.g. |
|
Phenanthrene |
* N |
10.46 |
8.7 |
3.1 |
12.3 |
|
Anthracene |
* N |
2.74 |
0.5 |
0.3 |
0.5 |
|
Fluoranthene |
* N |
4.28 |
6.0 |
0.4 |
4.1 |
|
Pyrene |
* |
2.01 |
5.0 |
0.1 |
2.3 |
|
Benz[a]anthracene |
* # N |
0.24 |
0.96 |
0.003 |
0.1 |
|
Chrysene |
* # N |
0.17 |
2.6 |
0.002d |
0.1d |
|
Benzo[b]fluoranthene |
* # |
0.1 |
0.4 |
n.g. |
n.g. |
|
Benzo[k]fluoranthene |
* # N |
0.08 |
0.2 |
n.g. |
n.g. |
|
Benzo[a]pyrene |
* # N |
0.09 |
0.3 |
0.001 |
0.03 |
|
Benzo[ghi]perylene |
* # N |
0.00 |
0.11 |
n.g. |
n.g. |
|
Dibenz[a,h]anthracene |
* # |
0.04 |
0.06 |
0.0001 |
0.002 |
|
Indeno[1,2,3-cd]pyrene |
* # N |
0.03 |
0.13 |
n.g. |
n.g. |
|
a |
* |
= |
Listed by US EPA as priority PAHs for environmental monitoring. |
|
# |
= |
United Kingdom Health and Safety Executive Priority PAHs (HSE 11); in addition, benzo[j]fluoranthene, anthanthrene, and cyclopenta[c,d]pyrene. |
|
|
N |
= |
Netherlands Priority PAHs used by the Dutch Ministry of Environment (BKH, 1995). |
|
|
b |
CTP1 and CTP2 are two different coal tar creosote samples used in the carcinogenicity study (section 7.3). |
||
|
c |
n.g. = not given. |
||
|
d |
Together with triphenylene. |
||
Table 5: Physical properties of some components of creosote.
|
Compound |
Chemical formula |
Relative molecular mass |
Boiling point (°C) |
Vapour pressure (Pa, 25 °C) |
Log Kow |
Exp.a log Ktw |
Aqueous solubility |
|
Aromatic hydrocarbons |
|||||||
|
Benzene |
C6H6 |
78.1b |
80b |
12 700c |
2.12b |
1780b |
|
|
Toluene |
C7H8 |
92.1d |
111d |
3700c |
2.69e |
515e |
|
|
Ethylbenzene |
C8H10 |
106.2d |
136d |
1240c |
3.13e |
152e |
|
|
p-Xylene |
C8H10 |
154.2d |
254d |
1180c |
3.18e |
215e |
|
|
Indene |
C9H8 |
116.2d |
182d |
160f |
2.92a |
3.68 |
insolubleg |
|
Biphenyl |
C12H10 |
154.2d |
254d |
0.7f |
3.16–4.17h |
7.5d |
|
|
PAHsi |
|||||||
|
Naphthalene |
C10H8 |
128.2i |
218i |
10.4i–12.3c |
3.37e |
4.00 |
31e,i |
|
1-Methylnaphthalene |
C11H10 |
142.2 |
242d |
8.3c |
3.87e |
28e |
|
|
2-Methylnaphthalene |
C11H10 |
142.2d |
241d |
9.0c |
3.97a |
4.76 |
24.6g |
|
2,6-Dimethylnaphthalene |
C12H12 |
156.2j |
263j |
20.4j |
4.35h |
2j |
|
|
Acenaphthylene |
C12H12 |
152.2d |
280d |
0.89i |
4.07d |
3.9d |
|
|
Acenaphthene |
C12H10 |
154.2i |
279i |
0.29i |
3.93i |
5.07 |
3.9i |
|
Fluorene |
C13H10 |
166.2i |
295i |
8.0 × 10⁻² i |
4.18e |
4.52 |
4.64k; 1.9e,i,l |
|
Phenanthrene |
C14H10 |
178.2i |
340i |
1.6 × 10⁻² i |
4.57e |
1.1e |
|
|
Anthracene |
C14H10 |
178.2i |
342i |
8.0 × 10⁻⁴ i |
4.5i |
73i |
|
|
Fluoranthene |
C16H10 |
202.3i |
375i |
1.2 × 10⁻³ i |
5.22i |
260i |
|
|
Pyrene |
C16H10 |
202.3i |
393i |
6.0 × 10⁻⁴ i |
5.18i |
135i |
|
|
Chrysene |
C18H12 |
228.3i |
448i |
8.4 × 10⁻⁵ i |
5.91i |
0.002i |
|
|
Benzo[a]pyrene |
C20H12 |
252.3i |
496i |
7.3 × 10⁻⁷ i |
6.50i |
0.0038i |
|
|
Dibenzo[a,h]anthracene |
C22H14 |
278.4 |
524i |
2.0 × 10⁻¹⁰ i |
6.50i |
5.80i |
0.0005i |
|
Phenolics |
|||||||
|
Phenol |
C6H6 |
94.1b |
182b |
61c |
1.46b |
93 000b; 88360e; 67 000m |
|
|
o-Cresol |
C7H8O |
108.1d |
191d |
37c |
1.98e |
26 000e |
|
|
m-, p-Cresol |
C7H8O |
108.1d |
202d |
22c/16c |
1.96/2.01d |
24 000m; |
|
|
2,4-Dimethylphenol |
C8H10O |
122.2d |
212d |
2.35e; 2.42d |
8795e |
||
|
Nitrogen-containing heterocycles |
|||||||
|
Pyrrole |
C4H5N |
67b |
131b |
0.75b |
58 800b |
||
|
Indole |
C8H7N |
117b |
254b |
2.00b |
1875b |
||
|
Quinoline |
C9H7N |
129b |
238b |
2.03b |
4.20 |
6300b; 60 000d,l,m |
|
|
Isoquinoline |
C9H7N |
129b |
243b |
2.08b |
4500b |
||
|
Benzoquinoline |
C13H9N |
179.2d |
3.54o |
||||
|
Acridine |
C13H9N |
179b |
346b |
3.4b |
3.36 |
46.5b |
|
|
Benz[c]acridine |
C17H11N |
229g |
|||||
|
Carbazole |
C12H9N |
167b |
355b |
3.29a; 3.71b |
4.01 |
1.2b; 0.91k |
|
|
Aromatic amines |
|||||||
|
Aniline |
C6H7N |
93g |
184g |
65g |
0.90g |
36g |
|
|
Sulfur-containing heterocycles |
|||||||
|
Thiophene |
C4H4S |
84b |
84b |
8400f |
1.81b |
3600b |
|
|
Benzo[b]thiophene |
C8H6S |
134b |
221b |
26p |
3.12b |
3.70 |
130b |
|
Dibenzothiophene |
C12H8S |
184b |
332b |
0.26p |
4.38a; 5.45b |
5.45 |
1.0b; 0.53k |
|
Oxygen-containing heterocycles / furans |
|||||||
|
Furan |
C4H4O |
68d |
31.3d |
80 300c |
1.34e |
28 600e; 10 000d |
|
|
Benzofuran |
C8H6O |
118b |
174b |
2.67b |
2.96 |
100–1000 (18 °C)g |
|
|
Dibenzofuran |
C12H8O |
168b |
285b |
4.12b; 4.31e |
4.74 |
4.75b; 3.1k |
|
|
a |
Rostad et al. (1985); experimental log tar/water partition coefficient. |
|
b |
Johansen et al. (1998). |
|
c |
Rippen (1999). |
|
d |
Verschueren (1996). |
|
e |
Broholm et al. (1999a). |
|
f |
At 20 °C; Auer-Technikum (1988). |
|
g |
ChemFinder.com Database & Internet Searching (http://www.chemfinder.com). |
|
h |
Hansch & Leo (1979). |
|
i |
Data on PAHs taken from IPCS (1998); details on other PAHs to be found there; solubilities from Mackay & Shiu (1977). |
|
j |
BUA (1990). |
|
k |
Lu et al. (1978). |
|
l |
Raven & Beck (1992); calculated from relation of Shiu et al. (1988). |
|
m |
Sundström et al. (1986). |
|
n |
IPCS (1995). |
|
o |
Bleeker et al. (1998). |
|
p |
At 20 °C; Mackay et al. (1982). |
Creosote formulations can contain, for example, petroleum oils (Fowler et al., 1994). For some wood preservation uses, creosote is mixed 1:1 with fuel oil (Hoffman & Hrudey, 1990). In order to increase anti-microbial efficacy, creosote has been mixed with "topped" coal tar (i.e., CTPV) (Todd & Timbie, 1983).
The vapour pressure of creosote is variable because of the number of compounds involved and is difficult to characterize. Vapour pressures for individual components range from, for example, 12 700 Pa for benzene to 2.0 × 10⁻¹⁰ Pa for the PAH dibenzo[a,h]anthracene (see Table 5).
Creosote itself is given as immiscible with water (US EPA, 1984a) or slightly soluble (von Burg & Stout, 1992). The individual components of creosote have very differing solubilities (see Table 5). The aqueous solubility and the mobility of PAHs in, for example, groundwater systems decrease as the molecular mass increases. The PAHs with three or more aromatic rings have a solubility of less than 1 mg/litre, whereas the solubilities of BTEX, phenols, and nitrogen-, sulfur-, and oxygen-containing heterocycles (NSO compounds) are orders of magnitude higher.
The aqueous solubilities given for individual chemicals are usually given as solid solubilities if the chemicals are a solid at ambient temperatures. In creosote, however, these compounds are present in liquid form. Liquid solubilities are always greater than solid solubilities, the differences increasing in proportion to their boiling points; for the compounds found in creosote, their liquid solubilities are 3–240 times greater than their solid solubilities (Raven & Beck, 1992). The few data found on liquid solubilities are given in Table 6. When liquids are present in a mixture, the properties of an individual component in the mixture vary from those of the pure component. Furthermore, as dissolution proceeds, the composition of the non-aqueous phase will change (Mackay et al., 1991). The term "effective solubility" is used to describe the solubility of a particular component in a complex mixture. As dissolution of creosote proceeds, the more soluble components will be rapidly lost, causing the mole fraction and therefore the effective solubilities of the other constituents to increase. Effective solubilities of the 10 US EPA priority PAHs in creosote are given in Table 6.
Table 6: Differences in aqueous solid and liquid solubilities for 10 US EPA priority PAHs in creosote where data were available, together with their effective solubilities.a
|
PAH |
Solid solubility |
Liquid solubilityb (mg/litre, 25 °C) |
Effective solubilitya (mg/litre) |
Range |
|
Naphthalene |
31c,d |
111.0 |
16.4 |
14.1–18.5 |
|
Acenaphthene |
3.9c |
129 |
1.97 |
1.71–2.19 |
|
Fluorene |
1.9b,c,d; 4.64e |
15.0 |
0.65 |
0.56–0.72 |
|
Phenanthrene |
1.1d |
0.54 |
0.46–0.61 |
|
|
Anthracene |
0.07c,e |
5.8 |
0.17 |
0.15–0.19 |
|
Fluoranthene |
0.26c |
0.081 |
0.066–0.096 |
|
|
Pyrene |
0.13c |
2.2 |
0.10 |
0.083–0.12 |
|
Benz[a]anthracene |
0.014c |
0.30 |
0.0020 |
0.0014–0.0025 |
|
Chrysene |
0.002c |
0.34 |
0.0022 |
0.0016–0.0028 |
|
Benzo[a]pyrene |
0.0038c |
0.12 |
0.00023 |
0.000 18–0.000 28 |
|
a |
Priddle & MacQuarrie (1994). Effective solubility in water is the solubility of a particular component in a complex non-aqueous-phase liquid. It is defined as the mole fraction of the component multiplied by the component’s pure aqueous solubility. |
|
b |
Raven & Beck (1992); calculated from relation of Shiu et al. (1988). |
|
c |
IPCS (1998); solubilities from Mackay & Shiu (1977). |
|
d |
Broholm et al. (1999a). |
|
e |
Lu et al. (1978). |
Log octanol/water partition coefficient (Kow) values for PAHs range from 3 to about 7. Other components of creosote have widely varying log Kow values, from 0.65 for pyridine (Leo et al., 1971) to 4 for biphenyl and dibenzofuran (see Table 5). The log organic carbon sorption coefficient (Koc) values for PAHs range from 2.4 to 7.0 (IPCS, 1998). Some experimental log tar/water partition coefficient (Ktw) values derived from partitioning studies of coal tar constituents were found to be reasonably comparable with the respective log Kow cited from other studies (Rostad et al., 1985; see Table 5).
Creosoted timber has a low electrical conductivity, which is recognized in the use of creosote-impregnated poles for electrical power transmission and for sleepers (railroad ties) where track signalling is practised (ITC, 1990).
Corrosive effects on a range of metals were slight: for example, liquid creosote on mild steel produced a weight loss of 2.3 µg/dm2 per day, whereas creosoted timber produced a weight loss of 27 µg/dm2 per day. Natural rubber, neoprene, polyvinyl chloride (PVC), and polythene were significantly affected by creosote, whereas other substances, such as PTFE and polypropylene, were least affected (ITC, 1990).
The ignition temperature for creosoted timber is 50–100 °C higher than that of untreated timber (ITC, 1990).
Thermal decomposition of creosote and wood treated with creosote at 400 °C, 600 °C, and 800 °C produced in the condensate the same PAHs present in the original substance. Up to about 400 °C, the substance distilled off; between 400 °C and about 545 °C, creosote was oxidatively decomposed. In addition, at about 400 °C, treated wood showed oxidative decomposition to aldehydes, ketones, and phenolic compounds. Experiments to detect polychlorinated dibenzodioxins (PCDDs) and dibenzofurans (PCDFs) showed raised levels of these compounds compared with blanks; however, due to the small number of samples, the difference was not significant (Becker, 1997).
The analysis of creosote — a mixture of hundreds of chemicals — is very complex. The presence of creosote is confirmed by the profiling analysis of its components. Different profiles of creosote chemicals are found in the different matrices: the most volatile are found in air, the most soluble in water, and those with greater sorptive capacity in sediment/soil (see section 5; see also Hale & Aneiro, 1997). Depending upon the matrix (e.g., air, water, soil/sediment, biological materials) from which the sample is taken, suitable cleanup and extraction are necessary (see sections below). HRGC with FID, HRGC-MS, or reversed-phase HPLC with FL have been the separation and determination methods most commonly used. Thin-layer chromatography (TLC)-FID can supplement methods such as gas chromatography (GC)-FID and GC-MS through its ability to quantify the polar and high-boiling fractions (Breedveld & Karlsen, 2000).
Most analytical efforts have concentrated on the PAHs, the dominant components of coal tar and coal tar creosote. However, a number of constituents, notably oxygen- and nitrogen-containing heterocycles, which exhibit appreciable solubilities, have been identified as major contributors to the acute toxicity of creosote leachates, and recent studies have aimed at analysis of these compounds.
First attempts to analyse creosote were by fractional distillation, but the process is tedious, and fractions overlap considerably. Lorenz & Gjovik (1972) used GC to analyse creosote both quantitatively, by a simulated fractional distillation, and qualitatively (see Table 3).
Samples of creosote can be separated into chemical class fractions (aliphatic hydrocarbons, neutral aromatic hydrocarbons, sulfur- and oxygen-containing aromatic compounds, and nitrogen- and hydroxyl group-containing aromatic compounds) using adsorption column chromatography with neutral alumina by elution with hexane, benzene, chloroform, and tetrahydrofuran/ ethanol, according to the method of Later et al. (1981).
Wright et al. (1985) isolated the PAHs and nitrogen-containing polycyclic aromatic compounds (NPACs) from creosote and separated these further using adsorption column chromatography with silicic acid using hexane:benzene, benzene, and benzene:ethyl ether eluents to isolate carbazole, amino-substituted enriched, and azaarene subfractions. Comparative quantitative chemical analysis of the PAH and NPAC fractions was achieved by HRGC using GC-FID. Before analysis of the amino-substituted enriched fraction, the amino-PAHs were selectively derivatized using pentafluoroproprionic anhydride. Over 30 PAHs and over 20 NPACs were identified (Wright et al., 1985; see Table 3).
The composition of creosotes from four producers was characterized by Nylund et al. (1992). The creosote samples were fractionated according to the method of Later et al. (1981) into four chemical classes. The creosotes and chemical fractions were analysed and their components identified by HRGC with FID, with MS, or with an alkali thermoionization detector (Nylund et al., 1992). In addition to the HRGC analysis, the 13 PAHs in the creosotes and in the distilled fractions boiling above 240 ºC were analysed with HPLC with FL. About 85 components were identified, some of which are listed in Table 3.
For the analysis of PAHs in creosote, the sample was dissolved in acetone, then injected into a GC-mass selective detector (GC-MSD) (Priddle & MacQuarrie, 1994).
Benz[c]acridine in creosote has been determined in silica-alumina column chromatography enriched fractions using GC with nitrogen-specific detection and GS-MS (Motohashi et al., 1991).
Constituents of creosote can appear both in the gaseous phase and/or on particles in air. Mass equilibrium depends, for example, on vapour pressure and adsorptive affinity of a compound for particles. Also, high airflow over the filter increases evaporation from particles to the vapour phase. High sampling velocities are generally used in environmental air monitoring in contrast to occupational exposure monitoring, potentially resulting in different ratios of compounds in the vapour phase to compounds on particles.
A sample of creosote was heated to 60 °C in a chamber, and evaporated constituents were collected simultaneously into absorption solution (toluene), on silica (desorbed with diethyl ether), on activated charcoal (desorbed with carbon disulfide), and on XAD-2 resin (desorbed with diethyl ether). The samples were analysed by means of HRGC-MS, and 28 compounds were identified. With activated charcoal, many components were lacking. Of the four sampling methods, XAD-2 was selected for further testing. The main components were analysed by GC with FID. The recovery of the tested main components ranged from 82 to 102%. The detection limit was about 1–5 µg/sample, corresponding to 0.01–0.05 mg/m3 for an air volume of 100 litres (Heikkilä et al., 1987). The 12 main components were phenol, cresols, xylenols, methyl styrene, indene, naphthalene, biphenyl, dibenzofuran, benzothiophene, quinoline, isoquinoline, and fluorene.
The concentration of airborne particles originating from coal tar or coal tar pitch has been monitored as CTPV. This is also known as benzene-soluble matter (BSM) or cyclohexane-soluble matter (CSM). The method has also been applied to creosote fumes (Markel et al., 1977; Todd & Timbie, 1983). However, the precision of the CTPV method with glass fibre filters was very poor when tested with creosote fumes (Todd & Timbie, 1983).
The US National Institute for Occupational Safety and Health (NIOSH) recommended that CTPV be collected on PTFE filters. Although this method has been withdrawn, NIOSH Method 5042 is fundamentally the same procedure and can be used (NIOSH, 1998). Air samples are collected by drawing a known volume of air through the sampler. The filters are analysed by extracting with benzene and gravimetrically determining the BSM. The US Occupational Safety and Health Administration (OSHA) Method 58 is also used to collect CTPV, but on glass fibre filters (OSHA, 1986). The glass fibre filters are analysed by extracting with benzene and gravimetrically determining the BSM of half of the extract. If the BSM exceeds the permissible exposure limit, the remaining extract is analysed by reversed-phase HPLC with UV-FL detection for select PAH determination. Borak et al. (2002) sampled creosote particles and vapours on closed-faced cassettes containing PTFE filters connected in a series with XAD-2 sorbent tubes. The filters and sorbent tubes were extracted with benzene to determine the BSM. The extracts were redissolved in acetonitrile, and 16 PAHs were analysed by HPLC with UV detection (Borak et al., 2002). Because Borak et al. (2002) had to evaporate the benzene to determine the BSM, some of the lower-molecular-weight PAHs may have been lost; hence, these determinations may be an underestimate of the actual exposure. The results showed that the BSM method was not sensitive enough to reliably measure low concentrations of creosote fumes.
Creosote vapours were sampled on XAD-2 and analysed with HRGC and FID, and particulate PAHs on prewashed glass fibre filters were extracted and analysed by HPLC with FL (Heikkilä et al., 1987).
Using GC with atomic emission detection, Becker et al. (1999) measured thiarene (sulfur-containing PAHs; 0.4–19 µg/m3) in the personal air space of workers in electrolysis halls of an aluminium reduction plant who were exposed to CTPV.
For details on the use of biological monitoring to monitor occupational exposure of creosote workers, see sections 2.3.8 and 5.3.
The water-soluble fraction of creosote is an extremely complicated mixture of low-molecular-weight aromatic compounds. When creosote comes into contact with water, the low-molecular-weight aromatics — the water-soluble fraction — are enriched in the aqueous phase. The fraction of phenols increases to about 45%, the NSO fraction increases to 38%, and the fraction of PAHs decreases to 17%. The dominant compounds in the water-soluble fraction are phenolics (phenol, mono- and dimethylphenols), benzene and alkylated benzenes, low-molecular-weight PAHs, and heterocycles containing nitrogen, sulfur, and oxygen (Arvin & Flyvbjerg, 1992). Changing the pH of a sample, followed by extraction of the aqueous phase by liquid–liquid extraction or solid-phase extraction, is widely used. It is valuable in separating neutral (e.g., PAHs), basic (e.g., azaarenes), and acidic (e.g., phenolics) compounds (Turney & Goerlitz, 1990; Mueller et al., 1991a; Middaugh et al., 1994a; see Figure 3). Available methods for the extraction, purification, identification, and quantification of creosote-related constituents in the aquatic environment have been reviewed (Johansen et al., 1996, 1998; Hale & Aneiro, 1997).
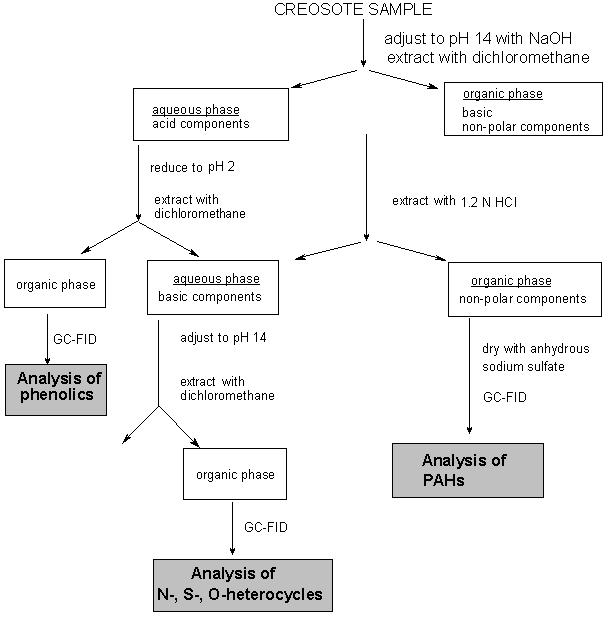
Fig. 3: Analysis of creosote according to Middaugh et al. (1994a).
Using the scheme for extraction of groundwater samples according to Figure 3, the components were analysed (Middaugh et al., 1994a). The limit of detection for PAHs in creosote was 400 ng/ml. Creosote heterocycles in organic extracts were also detected with GC-FID, but with slightly different temperature conditions. The limit of detection for creosote heterocycles was 200 ng/ml (Middaugh et al., 1994a). Phenolic compounds were detected by GC-FID/electron capture detector (ECD). The limit of detection for creosote phenolics was 50 ng/ml.
Turney & Goerlitz (1990) used a method similar to that given in Figure 3. Water samples were first analysed with HPLC. If organic compounds were present, they were extracted at different pHs with dichloromethane (DCM) into three separate fractions: the neutral aromatics, the phenolic compounds, and the nitrogen-containing heterocycles. The three isolated fractions were then analysed qualitatively and quantitatively using GC-MS. Two different analyses on two different fused silica columns, one polar and the other non-polar, were required to resolve the complex mixtures. The GC-MS was supplemented by GC with FID where appropriate. Quinolinone and isoquinolinone are difficult to extract from water and decompose at the high temperature of GC, so they were analysed by HPLC only (Turney & Goerlitz, 1990; Bestari et al., 1998a,b).
Whereas some authors (e.g., Rostad et al., 1984; Mueller et al., 1991a,b,c; Middaugh et al., 1994a,b; Sved & Roberts, 1995) have analysed for all creosote components, others (see below) have concentrated on particular groups of compounds. BTEX compounds were analysed with a hexane liquid–liquid microextraction GC technique (Barbaro et al., 1992). Aromatic hydrocarbons and derivatized phenols were extracted from groundwater with pentane. Compounds present at concentrations higher than 30 µg/litre were identified by GC-MS and quantified by GC-FID. Detection limits were 0.01 mg/litre for aromatic hydrocarbons and 0.02–0.03 for the phenols (Flyvbjerg et al., 1993; Dyreborg & Arvin, 1994).
Analysis of PAHs in aqueous samples was carried out by extraction with DCM and GC-MSD (Priddle & MacQuarrie, 1994). Other investigators used HPLC with FL for analysis of PAHs (Schoor et al., 1991; Hattum et al., 1998; Karrow et al., 1999).
NSO compounds (thiophene, benzothiophene, benzofuran) were extracted with diethyl ether/pentane and the organic phase analysed with GC-FID (Dyreborg et al., 1996a; Licht et al., 1997). Johansen et al. (1996, 1997, 1998) used the classical liquid–liquid extraction with DCM at pH 8 followed by GC-MS using scan mode or selective ion monitoring (SIM), giving detection limits for most heterocyclic aromatic compounds containing nitrogen, sulfur, or oxygen of 0.05 µg/litre. Other creosote compounds were extracted with diethyl ether/pentane followed by GC-FID. HPLC was used to detect 2-hydroxyquinoline, 1-hydroxy-isoquinoline, and 4-methyl-2-hydroxyquinoline, giving detection limits of 10, 10, and 50 µg/litre, respectively (Johansen et al., 1996, 1997, 1998).
Methods to extract coal tar and coal tar creosote from sediments include aqueous caustic reflux and sonification/blending. Many extraction procedures require initial drying, such as air or oven drying, lyophilization, or use of a chemical desiccant (Hale & Aneiro, 1997). Other methods include mechanical shaking with acetone followed by petroleum ether (Hattum et al., 1998), DCM, and acetone/hexane; and evaporation to dryness, the residue being subsequently dissolved in hexane (Hyötyläinen & Oikari, 1999a). The methods for the extraction and fractionation of creosote from soil and sediment are similar to those given in Figure 3. However, Mueller et al. (1991b,c) used a slightly different fractionation, whereby the oxygen- and sulfur-containing heterocycles are extracted in the organic phase with PAHs, leaving the nitrogen-containing heterocycles in a fraction of their own.
Wet soil was extracted in acetone, then centrifuged to remove solids. The supernatant was evaporated and resuspended in DCM, dried with anhydrous sodium sulfate, and then analysed by GC-FID. Phenols were quantified colorimetrically using the 4-aminoantipyrene method after extraction in alkaline methanol solution. Oil hydrocarbons were determined using infrared spectroscopy after extraction with 1,2-trichlorotrifluoroethane (Ellis et al., 1991). Breedveld & Karlsen (2000) likewise used GC-FID to determine the PAH content in dried soil samples.
Soil samples were collected and analysed for PAHs by US Environmental Protection Agency (EPA) Methods 3550 and 8310 (HPLC with UV-FL) and for total phenols using American Public Health Association (APHA) method APHA 5530 C (Guerin, 1999).
Hydrocarbons (mainly PAHs) were extracted from heavily contaminated soil using headspace solid-phase microextraction, and analysis was done by GC-MS (Eriksson et al., 2000, 2001).
Samples of creosoted wood were taken and dried at room temperature and Soxhlet-extracted with DCM, then washed with sulfuric acid and then sodium hydroxide. After drying with sodium sulfate, the solvent was changed to cyclohexane for GC-MSD determination of the PAHs (Gurprasad et al., 1995).
Creosote oil content in wood and soil samples was determined by extraction with a toluene/xylene mixture or Soxhlet extraction using toluene. Compound identification was by GC-MSD, and quantitative analysis was by GC-FID (Becker et al., 2001). Mostly PAHs and nitrogen-containing heterocycles were found. The same method was used by Bergqvist & Holmroos (1994).
Freshwater isopods were blotted dry, homogenized with anhydrous sodium sulfate, and extracted with n-hexane with micro-Soxhlet. Analysis of PAHs was by HPLC (Hattum et al., 1998).
Trout hepatic tissue was ground with anhydrous sodium sulfate and extracted with DCM. Gel permeation was used to remove the lipids and other hydrophobic co-extractives. The second gel permeation chromatographic fraction containing PAHs of interest was cleaned up by solid-phase extraction (SPE) with Florisil. Analysis was by GC-FID, with limits of detection of 2–7 ng/g lipid (Whyte et al., 2000).
Wet sediment or minced tissues (fish) were digested in boiling ethanol/potassium hydroxide. Following sample digestion, hydrocarbons were partitioned into cyclohexane by liquid–liquid extraction. The cyclohexane phase was concentrated and the PAH-containing fraction isolated by chromatography on Florisil. Analysis was by HPLC (Black et al., 1981).
Saponified snail tissue was extracted with isooctane/ dimethylsulfoxide (DMSO) and the resulting sample analysed for PAHs and nitrogen-, sulfur-, and oxygen-containing heterocycles using GC-MS (Rostad & Pereira, 1987).
Homogenized tissue was digested with lithium hydroxide and extracted with diethyl ether. The ether extracts were dried, concentrated, and fractionated on glass columns with activated silica gel. The saturated hydrocarbons were eluted with hexane; the aromatic hydrocarbons were eluted with DCM/hexane. Analysis was by GC-FID and GC-MS (DeLeon et al., 1988).
The urinary PAH metabolites 1-pyrenol (1-hydroxypyrene) and 1-naphthol (1-hydroxynaphthalene) have been used to attempt to monitor creosote PAH exposure (Heikkilä, 2001). The use of a single marker to control or monitor exposure to a mixture assumes that the components of the mixture do not act additively and that there are no toxicokinetic interactions between the members of the mixture (Viau, 2002). Experimental studies have shown that co-exposure to naphthalene does not alter the toxicokinetic profile of the urinary excretion of 1-pyrenol in the rat exposed to pyrene (Bouchard et al., 1998). In human volunteers, it was shown that dermal exposure to pure pyrene or to creosote produced the same toxicokinetic profile for the urinary excretion of 1-pyrenol (Viau & Vyskocil, 1995).
In workers of a coke oven plant, there was an excellent correlation between airborne pyrene and BaP; further, 1-pyrenol was correlated with both airborne pyrene and airborne PAHs, suggesting that 1-pyrenol could be used as a biomarker of exposure to carcinogenic PAHs (Kuljukka et al., 1996) (see also section 5.3).
1-Pyrenol, a metabolite of the PAH pyrene, has been used as a biomarker of exposure to creosote (Jongeneelen et al., 1985, 1988a; Van Rooij et al., 1993a,b; Viau et al., 1993; Elovaara et al., 1995; Heikkilä et al., 1995, 1997; Borak et al., 2002). The method of determination consists of enzymatic hydrolysis of conjugated 1-pyrenol in urine samples, followed by SPE and reversed-phase HPLC with FL (Jongeneelen et al., 1986).
Heikkilä et al. (1995, 1997) monitored the urinary concentration of 1-naphthol as its pentafluorobenzylbromide derivative using HRGC with an ECD, a modification of the method of Keimig & Morgan (1986). Urinary 1-naphthol was hydrolysed with concentrated hydrochloric acid at 100 °C (water bath) and extracted with DCM. The limit of detection was 0.07 µmol/litre, corresponding to 5 µmol/mol creatinine. Yang et al. (1999) reported an improved method with a detection limit of urinary naphthols up to 0.27 µg/litre using enzyme hydrolysis of the samples with heating to 37 °C followed by extraction, derivatization, and HRGC-MS-SIM. Simultaneous determination of urinary metabolites of phenanthrene, fluoranthene, pyrene, chrysene, and BaP from coke workers has been described (Grimmer et al., 1997).
There are no natural sources of coal tar creosote.
Creosote is generally obtained through the fractional distillation of coal tars, which in turn are by-products of the destructive distillation ("carbonization" or "coking") of coal to coke or town gas (IARC, 1985) (see Figure 1). During the distillation of coal tar, the first fractions are low-molecular-weight oils, and the final product is coal tar pitch. Creosote is obtained at a temperature intermediate between the temperatures at which the first and final products are obtained. The distillation range of creosote is from about 200 °C to about 400 °C (RPA, 2000). Some specifications for creosote are given in Table 2. Recent regulations in different countries may impact the composition of creosote used (see section 2).
Creosote production in the USA falls into two categories: distillate (100%) creosote and creosote in coal tar solution. Distillate production in 1992 was 240 000 tonnes; production of creosote in coal tar solution was 110 000 tonnes (US International Trade Commission, 1994).
It is difficult to give an accurate overview of production levels, as the industry has changed significantly in the last decade due to economic and environmental restrictions. In former times, in the USA, there were 24 creosote-producing plants (Todd & Timbie, 1983) and over 600 wood-preserving plants that used 454 000 tonnes of creosote annually (Fowler et al., 1994). Other more recent reports give other figures. In 1997, there were 445 wood-preserving plants in total, 70 of which treated wood with creosote. These plants treated 2 758 000 m3 of wood and consumed 223 290 000 litres of creosote and creosote solutions. Assuming creosote has an average density of 1.03 kg/litre, this would be equivalent to approximately 230 000 tonnes of creosote (Micklewright, 1998).
In the EU (nine plants), the creosote production volumes were about 64 000 tonnes in 1998, about 66 000 tonnes in 1999, and some 70 000 tonnes in 2000 (personal communication to IPCS, 2003). RPA (2000) estimates a production volume of 100 000 tonnes or more in the EU based on 10 plants.
UK DOE (1988) has estimated that 40 000 tonnes of creosote are manufactured each year in the United Kingdom; approximately 25% is exported, 25% is used by industry, and 50% is used for immersion treatment and retail domestic use. RPA (2000) estimates that approximately 20 000 tonnes of creosote are used in the United Kingdom each year.
Although details of creosote production levels in other countries was not available, it should be mentioned that coal tar creosote is produced in countries where carbonization or coking takes place.
Coal tar creosote is a wood preservative and water-proofing agent and has been used for (RPA, 2000):
In Canada, there are five creosote pressure-treating facilities operating in Canada, as well as small facilities using dip tanks and vapour chambers. These facilities collectively use 21 × 106 kg (21 000 tonnes) of creosote per year. Preservation of railway ties uses 54% of the creosote, marine pilings use 37%, and bridge deckings, timers, and utility poles use the remaining 9% (CEPA, 1993).
The majority of creosote used in the EU is for the pressure impregnation of wood. The West European wood preservation industry is reported to supply about 710 000 m3 of creosote-treated wood per year, which is about 11% of treated wood (RPA, 2000). A previous estimate was 1 million cubic metres of creosote-treated wood used in Europe in 1990 (BKH, 1995). The value of 710 000 m3 would account for the majority (90 000 tonnes per annum) of creosote use in the EU, with an average of 120 kg/m3 wood (RPA, 2000).
Other preservation application modes include dipping, deluging, and spraying. Following treatment, the timber is dried by allowing the solvent to evaporate from the treated timber in the open air.
The extended life expectancy of creosoted compared with untreated wood reflects the retention capacity of creosote in the wood; for example, as much as 75% of creosote applied to marine pilings will remain in the wood after 40 years of service. The life expectancy for untreated wood is less than 10 years (Bestari et al., 1998b)
Until recently, the use of creosote by the general public in Europe was almost exclusively limited to the United Kingdom and Ireland. It is reported that approximately half of the creosote used in the United Kingdom — i.e., at least 10 000 tonnes per annum — was for use by the general public (brushing) (RPA, 2000). BS 144 Type 3, containing less than 50 mg BaP/kg, is the most commonly used creosote formulation for brushing applications. Due to concerns about the carcinogenic potential of creosote, the EU passed an amendment (EU, 2001) to the "Marketing and Use" Directive (EU, 1976), which required that all amateur uses of creosote be prohibited by 30 June 2003 (HSE, 2003). In the EU, the use or sale of creosote or newly treated wood containing BaP at levels above 50 mg/kg to private consumers is no longer permitted. Creosoted wood may be used only for professional and industrial applications. It may not be used inside buildings, in contact with foodstuff, for containers for growing purposes, at playgrounds, or at other sites at risk of skin contact (EC, 1999). In the Netherlands, sale and use of creosote containing more than 50 mg BaP/kg and treated products are totally banned (EC, 2001). In the USA and many other countries, the sale and use of coal tar creosote are now restricted to certified applicators or to persons under their direct supervision (US EPA, 1984a; ATSDR, 2002).
Coal tar creosote prevents animal and vegetable growth on concrete marine pilings and is a component of roofing pitch, fuel oil, and lamp black and a lubricant for die moulds (HSDB, 1999). Other uses reported include animal and bird repellent, insecticide, animal dip, and fungicide.
About 2% of the creosote produced annually was used for non-wood purposes — for example, blended with petroleum distillates as a herbicide, insecticide, and disinfectant. Many of these uses have now been prohibited. In the USA, for example, interior application is prohibited (US EPA, 1984a).
There are a large number of creosote treatment facilities in the USA. Bennett et al. (1985) reported more than 4000, Mueller et al. (1989) reported over 700, and Fowler et al. (1994) reported 600 wood-preserving plants using almost half a million tonnes of creosote each year. Micklewright (1998) reported that there were 70 wood-preserving plants in the USA that treated wood with creosote. During pressure impregnation of wood products, excess free product may be released from the treated materials. Leaching of spilled wastes from these application sites has been common (e.g., Black, 1982; Borthwick & Patrick, 1982; Goerlitz et al., 1985; Malins et al., 1985; Merrill & Wade, 1985; Elder & Dresler, 1988; Mueller et al., 1989; Pollard et al., 1994; Pereira et al., 1987). Large companies either treat aqueous wastes in their own biological treatment plants or discharge these wastes into municipal systems that receive biological treatment.
Seventy-seven large handlers of coal tar creosote in the USA report that 97% (500 000 kg) of the creosote released to the environment from their facilities is emitted through air (TRI97, 2000).
The behaviour of creosote in the environment depends upon the physical and chemical properties of its components. Most of the information available refers to creosote PAHs, but there are some data on the heterocyclic and phenolic components.
After input to the environment, creosote is "weathered," a multifactor process involving evaporation, dissolution, adsorption to particulate matter, and photo-oxidation. These processes affect the various constituents to different degrees, depending on their physicochemical properties (and possible mutual interactions). The extent of reactions is influenced by weather conditions and other environmental factors.
Characteristic of creosote-impregnated wood products is "bleeding" or exudation of creosote. The exudate may evaporate, remain liquid, or harden into a semisolid state on the surface of the treated wood. Bleeding continues for many years and is enhanced on hot and sunny days (see ITC, 1990).
Creosote constituents occur in the atmosphere in the gaseous and the particulate phases. The distribution between the two phases depends strongly on the vapour pressures of the different creosote constituents. According to Eisenreich et al. (1981), compounds with vapour pressures of >10–5 kPa should exist predominantly in the vapour phase, and those having vapour pressures of <10–9 kPa should exist predominantly in the particulate phase, although, in reality, most high-molecular-weight organics lie between these extremes.
Vapour pressures of individual components detected in creosote range from, for example, 12 700 Pa for benzene to 2.0 × 10⁻¹⁰ Pa for dibenzo[a,h]anthracene (see Table 5). Generally, low-molecular-weight PAHs (e.g., naphthalene, anthracene, and phenanthrene) are mainly in the gas phase, and high-molecular-weight PAHs are mainly bound to particles. Phenolic compounds, including cresols, as well as the heterocyclic fraction tend to be in the vapour state (see section 2). However, it is not clear how the specific composition of creosote may modify the distribution behaviour of the individual components.
PAHs can be transported over long distances without significant degradation (IPCS, 1998), but this is not the case for phenolic compounds, due to rapid photochemical attack and rain scavenging (IPCS, 1995). There is no comprehensive evaluation of the atmospheric transport of heterocyclic compounds.
The volatilization of five PAHs (acenaphthene, fluorene, phenanthrene, anthracene, fluoranthene) from creosote-treated wood has been determined using chambers in the laboratory. The total exposed surface area of wood (yellow pine, Pinus strobus) was 0.118 m2 and was painted with approximately 120 ml of creosote (density: 0.9 g/ml). Rates of desorption followed first-order kinetics and were higher at 30 °C than at 4 °C. Mean sum PAH fluxes varied from 2.6 (±1.5) mg/m2 treated wood per day at 4 °C to 29.5 (±6.1) mg/m2 treated wood per day at 30 °C. Desorption half-lives ranged from 0.7 to 31 years at 4 °C and from 0.3 to 1 year at 30 °C for fluoranthene and acenaphthene, respectively (Gevao & Jones, 1998). Emissions of creosote compounds from treated wooden ties used in the Swiss railway network were calculated to be 1710 tonnes per year, corresponding to an emission factor of 208 mg/m2 per day. Emission factors for volatile PAHs and phenolic compounds were calculated to be 20.3 and 0.58 mg/m2 per day, respectively (Kohler et al., 2000).
The transport of creosote compounds from the water surface depends on their volatilization rate and is not considered to be a dominant process for PAHs and cresols, as can be derived from their physicochemical properties (see section 2; e.g., Henry’s law constants: naphthalene: 49 Pa·m3/mol; dibenzo[a,i]pyrene: 0.000 449 Pa·m3/mol; cresols: 0.08–0.13 Pa·m3/mol). Heterocycles are even less volatile than PAHs (see section 2; e.g., vapour pressure of naphthalene/quinoline: 10.4/1.2 Pa, 25 °C).
In a 56-day laboratory microcosm study, the average volatilization of phenanthrene (at 10 °C and 20 °C) was found to be less than 2% (while binding to solids was up to 59%). The microcosms consisted of flasks each containing creosote- and pentachlorophenol (PCP)-contaminated aquifer material (13 g, sampled in the USA) and artificial simulated groundwater (12 ml) and were spiked with 14C-labelled phenanthrene (Mohammed et al., 1998).
1) Principal factors
Principal factors that control the partitioning of creosote (components) between surface water sheen, water column, suspended particles, bottom sediment, and sediment pore water include aqueous solubility, affinity to organic phases, and sorptive capacity.
The solubility in pure water for the most common PAH components of creosote ranges from 0.5 µg/litre for dibenzo[a,h]anthracene to 31 mg/litre for naphthalene (see Table 5). Phenolic compounds are highly soluble and mobile (e.g., phenol: 67–93 g/litre; p-cresol: 21–24 g/litre). Heterocyclic compounds are more water soluble than PAHs with similar molecular weights; for example, quinoline, the heterocyclic analogue of naphthalene, has a solubility of 6300–60 000 mg/litre (see section 2). Accordingly, a fractionation process starts when creosote comes into contact with water. For example, the fraction of PAHs decreased from about 85% in the original creosote to about 17% in the aqueous phase, whereas the fraction of phenols increased from about 10% to 45% and the heterocyclic (NSO) fraction from about 5% to 38% (Arvin & Flyvbjerg, 1992).
In natural waters, however, a concentration-dependent exchange equilibrium exists between adsorbed and soluble states, and a number of organic compounds (in natural water and wastewaters) can increase the solubility of some PAHs (NRCC, 1983; Swartz et al., 1989). For example, BaP and chrysene have often been found near creosote sites at higher maximum concentrations than expected from their common solubilities (Kiilerich & Arvin, 1996).
The log Kow of the individual components of creosote varies between 0.75 for pyrrole and 6.5 for BaP (see Table 5). In general, PAHs show a high affinity for organic phases. In connection with a case of creosote groundwater contamination, the partitioning of PAHs and nitrogen heterocycles (n = 31) between a two-phase fluid system (an upper aqueous phase and a lower oily tar phase), which developed in the aquifer, has been studied. For most compounds, a good correlation was found between their log Ktw and their respective log Kow values (Rostad et al., 1985).
Relatively high Koc values indicate a strong adsorptive capacity of many creosote PAHs (IPCS, 1998; see also section 2) and some cresols (IPCS, 1995; see also section 2).
Generally, the high-molecular-weight aromatic organic compounds (more than three rings), with relatively low solubilities and high adsorptive capacities, dominate the sediments, whereas the low-molecular-weight aromatic organic compounds (fewer than three aromatic rings) partition selectively into the aqueous phase (Padma et al., 1999; see also section 5). In cases of severe contamination, PAHs can also exist in a non-aqueous-phase liquid (oil phase), which complicates the distribution equilibria (Black, 1982; Priddle & MacQuarrie, 1994; Hughes et al., 1997).
The more water-soluble fraction, including the naphthalenes, acenaphthene, fluorene, and heterocyclic and phenolic compounds, can (be dissolved and) be transported rapidly in groundwater and surface water. In a field experiment, some components of creosote were monitored after creosote was intentionally placed into an aquifer, thereby creating a limited plume of contaminated groundwater. From samples collected after 278 and 471 days, it was evident that some nitrogen-containing heterocycles (i.e., quinoline and indole) were travelling faster than naphthalene (consistent with their higher aqueous solubilities). Another heterocycle, carbazole (which has an aqueous solubility less than that of naphthalene), was moving at a rate closer to that of naphthalene than to that of quinoline. The higher-molecular-weight PAHs (e.g., phenanthrene, anthracene, chrysene) moved very slowly, if at all, from the creosote source (Fowler et al., 1994).
Consistently, creosote-contaminated sediments are typically found to be enriched with the hydrophobic creosote aromatic organic compounds, when compared with the original creosote (Black, 1982; Bieri et al., 1986; Krone et al., 1986; Padma et al., 1998, 1999; Hyötyläinen & Oikari, 1999a). Many creosote aromatic organic compounds adsorbed to sediments can persist for decades (e.g., Black, 1982; Bieri et al., 1986; Catallo & Gambrell, 1987; Hyötyläinen & Oikari, 1999a).
Natural and anthropogenic activities, such as tides, storms, bioturbation, shipping, and dredging, may sometimes cause dissolution of sediment-associated creosote compounds and resuspension into the water column, resulting in a long-term, low-level exposure of biota to these components. In contrast, the hydrophilic compounds are likely to influence the biota immediately after introduction into the aquatic environment (e.g., Padma et al., 1999).
In some studies, however, it was observed that sedimentation isolated creosote-contaminated layers from the water, thereby slowing and eventually halting the dissipation of the more water-soluble PAHs (CEPA, 1993). Huntley et al. (1993) reported, for the Arthur Kill and other rivers in the USA, sedimentation rates of 0.6–8.9 cm/year. Within sediments, the interstitial water is enriched with the low-molecular-weight PAHs (NRCC, 1983; Padma et al., 1999).
The in situ distribution of PAHs between dissolved and colloidal (mainly composed of clay, iron oxides, iron sulfides, and quartz particles) phases has been investigated in creosote-contaminated aquifers (Villholth, 1999). For benzo(b+j+k)fluoranthene, benzo[e]pyrene, BaP, and benz[a]anthracene, the mass associated with the coarse (>100 nm) colloidal fraction constituted 34.7, 12.3, 10.7, and 5.4% of their total masses, respectively. The extent of partitioning was related to the hydrophobicity of the PAHs. Because colloids are mobile, such an association plays a role in co-transport of PAHs.
2) Source-related data
Creosote reaches surface waters from creosoted wooden constructions in direct contact with water (pilings, bank protection, boats, etc.), from creosote-contaminated sites via effluents or groundwater, or from accidental spills. Each of these situations has its specific complex distribution dynamics. Some findings relating to wooden creosoted constructions and to the so-called waste creosote are discussed separately in the following paragraphs.
Wooden creosoted constructions:
Variable losses of creosote (unspecified) have been reported from treated pilings during several years of immersion in estuarine/marine waters (Hochman, 1967; Miller, 1977).
The migration of 15 creosote PAHs (naphthalene, 2-methylnaphthalene, 1-methylnaphthalene, biphenyl, acenaphthylene, acenaphthene, dibenzofuran, fluorene, phenanthrene, anthracene, carbazole, fluoranthene, pyrene, 1,2-benzanthracene, chrysene) from treated wood pilings into fresh water and seawater has been investigated in the laboratory (Ingram et al., 1982). All of the PAHs present in the wood migrated into water, with higher concentrations in fresh water than in seawater. The six major compounds (70–80% of total compounds that migrated) were naphthalene, phenanthrene, acenaphthene, dibenzofuran, fluorene, and 2-methylnaphthalene. The rate of migration increased with increasing temperature (20–40 °C); it was lower for 12-year-old aged pilings than for freshly treated pilings. The annual loss of total PAHs from a piling (total surface area of 15 000 cm2, unaged wood in seawater at 30 °C) has been estimated to be about 77–147 g (Ingram et al., 1982). Another laboratory leaching test using a recently developed method (derived from the standard DEV S4 test, DIN 38414; duration: 120 h; DIN, 1984) showed that PAHs and heterocyclic compounds are leachable from creosote-treated wood (creosote: no complete specification; wood: Austrian pine, Pinus nigra) into deionized water, into an aqueous buffer solution (pH 4.7), and into an aqueous solution of humic substances. Maximum leaching occurred during the first 24 or 48 h. The leached amounts of nitrogen heterocycles (quinoline, isoquinoline, indole, 2-methylquinoline) were at least 1 order of magnitude higher than those of the PAHs (naphthalene, acenaphthene, fluorene, phenanthrene, fluoranthene, pyrene) and of dibenzofuran. The nitrogen-containing heterocycles leached faster than PAHs and dibenzofuran (Becker et al., 2001).
A leaching rate of 273 mg/piling per day for total PAHs has been estimated for pilings (total surface area: 5455 cm2) in fresh water (Bestari et al., 1998b). In this study, the distribution of 15 PAHs (arranged in order of increasing molecular weight: naphthalene, acenaphthene, fluorene, phenanthrene, anthracene, fluoranthene, pyrene, benz[a]anthracene, chrysene, benzo[b]fluoranthene, benzo[k]fluoranthene, BaP, benzo[g,h,i]perylene, indenol[1,2,3-cd]pyrene, dibenz[a,h]anthracene) in water, sediment, and PVC strips has been assessed in outdoor freshwater microcosms containing 0.5, 2, 3, 4, or 6 creosote-impregnated pilings. Conditions were parallel to those of another experiment (Bestari et al., 1998a) running with liquid creosote applications and described below. The concentrations of total PAHs (dissolved and suspended) increased rapidly in water up to 7 days post-exposure, yielding a clear dose-dependent concentration gradient ranging from 7.3 µg/litre (0.5 pilings) to 97.2 µg/litre (6 pilings). Thereafter, they decreased gradually to approximately background levels (two control microcosms containing untreated pilings) by day 84 (similarly to the parallel experiment with liquid creosote). The loss from water was not accompanied by an increase of PAHs in sediments, although an increase in PVC-bound PAHs was observed. At no time were the three PAHs with the highest molecular weights (see above) detected in the water samples (maybe due to retention in the pilings); chrysene and BaP disappeared from the water column after 7 days (maybe due to adsorption to lipophilic structures); anthracene was lost between 42 and 84 days (maybe due to photolytic and microbial degradation). The relative composition of the other PAHs did not change significantly in water over the course of the study. The average disappearance half-time of sum PAHs from water was calculated as 48.5 days (range: 42.8–60.7 days). This was close to the value of 38.7 days (range: 21.7–69.3 days) found in the parallel study.
Waste creosote:
Contamination of groundwater and surface waters by waste creosote (e.g., due to seepage from unlined containment ponds or spillage over retaining walls in creosote facilities; see also section 3) has occurred at several sites (see section 5). At some locations, it was observed by means of exploratory wells that the contaminated plume moved vertically through surface soils and then down-gradient in the direction of net groundwater flow (Ehrlich et al., 1982; Bedient et al., 1984; Goerlitz et al., 1985; Ball, 1987; Baedecker et al., 1988). PAHs and other organic compounds have been transported in this way to groundwater, which flows, for example, towards nearby estuarine/coastal waters (Goerlitz et al., 1985) or rivers (Hickok et al., 1982; Raven & Beck, 1992). Direct horizontal transport from creosote-contaminated sites into (and within) surface water systems has also been documented (Black, 1982; Elder & Dresler, 1988). Obvious pools of oily materials were sometimes visible in water or sediments (Black, 1982; Huggett et al., 1987; McKee et al., 1990).
A controlled field experiment has been performed in Canada to observe the migration and natural fate of a creosote plume in groundwater. For this purpose, a modified creosote mixture (density: 1.03 g/ml; raw creosote, 69.5 kg, from Carbochem, Canada, amended with carbazole, 0.45 kg, p-cresol, 0.5 kg, phenol, 1.0 kg, m-xylene, 3.0 kg) in sand (about 5800 kg) was emplaced beyond the groundwater table. The developing dissolved organic plume was studied over a 4-year period by monitoring seven representative compounds (phenol, m-xylene, naphthalene, 1-methylnaphthalene, phenanthrene, dibenzofuran, carbazole). In total, more than 7800 samples were analysed. Mass balance calculations indicated that ongoing transformation occurred. Phenol migrated as a discrete slug plume and almost completely disappeared after 2 years. The m-xylene migrated outward to a maximum distance at approximately 2 years and then receded back to the source; carbazole showed similar behaviour; the dibenzofuran plume remained relatively constant in extent and mass over the last 2 years of monitoring. The naphthalene and 1-methylnaphthalene plumes continued to increase in extent and mass over the observation period. The behaviour of phenanthrene was less conclusive and difficult to determine due to its high adsorptive capacity. There were several indications (measurement of redox-sensitive parameters in the vicinity of the plume, accumulation of aromatic acids within the plume, measurement of phospholipid acids) that the observed plume mass loss was due to microbial biodegradation. From their overall results, the authors concluded that the depletion behaviour of creosote is highly site-specific. They suggested that time frames required for creosote disappearance may range from years to decades for the higher-solubility compounds (e.g., phenolics and monocyclic aromatics) and from decades to centuries for the lower-solubility compounds (e.g., PAHs and heterocyclic aromatics) (King & Barker, 1999; King et al., 1999).
The distribution of 15 priority PAHs (the same PAHs as used in Bestari et al., 1998b; see above) in water, sediment, and absorbed to PVC strips was assessed over 84 days following direct application of liquid creosote (for composition, see Table 4) to aquatic outdoor microcosms. The nominal creosote concentrations of the treated microcosms (n = 14; natural riverine sediments, water from ponds, biotic community due to natural colonization and transfer) ranged from 0.06 to 109 mg/litre; two microcosms served as controls. Concentrations of total PAHs in water decreased exponentially with time — for example, from 7.3 µg/litre (post-treatment day 2) to 0.8 µg/litre (post-treatment day 84) in the lowest treatment and from 5803 µg/litre (day 2) to 13.9 µg/litre (day 84) in the highest treatment. There was also a change in relative proportions of the 15 PAHs monitored: both low- and high-molecular-weight PAHs were lost first from the water column, followed by PAHs of intermediate molecular weight (4–5 aromatic rings). In sediments, a dose-dependent increase in sum PAHs was observed above the 0.59 mg creosote/litre treatment, followed by a decline thereafter in all but the highest treatment. At this concentration (109 mg creosote/litre), total sediment PAHs remained relatively constant (68 µg/g) over the 12-week period; within the individual PAHs, there was a declining trend in sediment concentrations of low-molecular-weight PAHs, whereas the concentrations of intermediate- and high-molecular-weight PAHs continued to increase. The relative composition of PAHs on the PVC lining was dominated by low-molecular-weight PAHs (Bestari et al., 1998a).
The same principal physicochemical properties as discussed in section 4.1.2 for the aquatic environment regulate the mobility of creosote (components) in soil, resulting in partitioning between soil organic matter, solid surfaces, soil water, residual oily phases, and gaseous phases.
Loss of creosote components from soil by volatilization may be significant only for some low-molecular-weight compounds (with relatively high vapour pressures; see section 2) and for highly contaminated soils. Quantitative data obtained with creosote-contaminated soil as the source were not available.
Depending on soil type, hydrogeology, amount of creosote released, etc., transport processes such as advection (movement with the bulk fluid), dispersion, adsorption, or decay contribute to a different degree to the movement of creosote in soil. Creosote components often persist for long times near their sources; on the other hand, some migration to groundwater and surface water has occurred. Some data have been summarized for wood products in service and for creosote waste sites, as follows.
1) Wooden creosoted constructions
Creosote components are slowly released from treated wood products (poles, railroad ties, etc.) by oil exudation, rainwater (or irrigation) leaching, and volatilization of the lighter fractions (Petrowitz & Becker, 1964, 1965; Bosshard, 1965; Henningsson, 1983; Nurmi, 1990; Behr & Baecker, 1994; Gurprasad et al., 1995; Gevao & Jones, 1998). Accordingly, soil samples around and under impregnated poles showed high contents of creosote (see section 5) after 10 years (up to 90 g/kg dry weight; Nurmi, 1990) or 40 years (up to 1.5 g/kg dry weight) (Bergqvist & Holmroos, 1994) of service. Similarly, PAHs have entered surrounding soil, ditches, and groundwater in a storage and use area of old railway ties; migration of PAHs in soil appeared to be slow (Sandell & Tuominen, 1996).
In a terrestrial microcosm study with wooden (pine) posts impregnated with creosote spiked with 14C-labelled phenanthrene and acenaphthene, the mass balance of the radioactive material within compartments was investigated 2.5 months after introduction of the posts in the experimental ecosystem; the major part of labelled phenanthrene/acenaphthene remained in the posts (95%/93.5%), and a small portion distributed to soil (2.7%/4.3%), air (1.4%/1%), and biota (0.9%/1.2%). The highest concentrations were found in areas immediately surrounding the posts. No radioactivity was detected below the first 10-cm soil layer or in leachate or groundwater (Gile et al., 1982).
2) Waste creosote sites
Waste creosote in soil can occur as lighter- and heavier-than-water fractions, or even as a free liquid pool. The light fraction (moving with fluctuating water levels) contains mainly the water-soluble components. The heavy fraction tends to travel downwards to impervious soil layers (which it can flow along), in this way sometimes reaching groundwater and surface waters (CEPA, 1993; see also section 4.1.2). Near old wood-preserving facilities, creosote residues have been found to persist in soil for many years (e.g., Sundström et al., 1986; Borazjani et al., 1990; Acharya & Ives, 1994; see also section 5). At deeper soil layers (about 0.5–1.5 m), the composition of residues was sometimes similar to that of the original creosote product, whereas in the surface layer (0–20 cm), many low-molecular-weight compounds were missing (KEMI, 1995). At greater depths (4–5 m), mainly two- and three-ring PAHs could be observed (Breedveld & Karlsen, 2000).
In a laboratory model experiment (simulating a creosote spill), the leaching of six aromatic compounds from a saturated sand column contaminated artificially with creosote (116 g mixed with 2.56 kg sand) was studied over 36 days. The compounds studied (benzene, toluene, o-xylene, phenol, o-cresol, and naphthalene) accounted for 21.8% (w/w) of the creosote (no further specification). Phenol and o-cresol were totally leached from the contaminated sand within the first 5 days, followed by benzene within 10 days and toluene after 36 days. Naphthalene and o-xylene were not totally leached when the experiment ended. Some loss by evaporation was indicated by a typical creosote smell before the experiment started (Dyreborg & Arvin, 1994). Another soil column leaching test with soil (heterogenic composition) from a creosote-contaminated area showed that about 9% of the creosote (no specification) could be leached out (Ellis et al., 1991). Broholm and co-workers studied the transport of 25 organic compounds typical of creosote (monocyclic aromatic hydrocarbons [MAHs], PAHs, heterocyclic aromatic compounds [HACs], phenolic compounds) in a large (0.5 m in height, 0.5 m in diameter) macroporous clayey till column (139 days, biodegradation prevented by sodium azide). Results showed that the transport of low-molecular-weight compounds was not retarded relative to bromide, whereas the transport of the high-molecular-weight organic compounds was retarded significantly. The following order (with increasing retardation) was observed: benzene, pyrrole, toluene, o-xylene, p-xylene, ethylbenzene, phenol, benzothiophene, benzofuran < naphthalene < 1-methylpyrrole < 1-methylnaphthalene, indole, o-cresol, quinoline < 3,5-dimethylphenol, 2,4-dimethylphenol < acridine < carbazole < 2-methylquinoline < fluorene < dibenzofuran < phenanthrene, dibenzothiophene. This order was unexpected based on the octanol/water partition coefficients of the organic compounds (Broholm et al., 1999a). Transport through a column of fractured clayey till resulted in a comparable order of retardation (Broholm et al., 1999b). A fast downward migration of selected compounds (naphthalene, 1-methylnaphthalene, toluene, phenol, dimethylphenols, o-cresol, benzothiophene, quinoline) — coupled with some attenuation, probably due to biodegradation — was also observed in a clayey till field experiment (Broholm et al., 2000).
Individual creosote components are bioavailable to widely varying degrees, as seen for PAHs (e.g., Hattum et al., 1998; IPCS, 1998), heterocyclic compounds (e.g., Southworth et al., 1978, 1980; Eastmond et al., 1984), and phenolic compounds (e.g., IPCS, 1995).
Most data in connection with creosote exposure refer to PAHs.
A limited uptake of PAHs in plants (ryegrass, Lolium perenne L.) has been observed in a terrestrial microcosm study with creosote-treated wood as initial creosote source. After 2.5 months, 0.1% of the applied 14C-labelled phenanthrene and 0.04% of the acenaphthene were detected in plant tissue (Gile et al., 1982).
Measurements of the possible adsorption of PAHs to or deposition of PAHs onto roots or leaves of plants near creosote sources are not available. However, in general, PAHs are significantly subjected to both wet and dry deposition onto plant surfaces, with little transport to inner plant tissues possible (e.g., Kipopoulou et al., 1999; Howsam et al., 2000, 2001). Adsorption of PAHs to roots of terrestrial plants occurs, but translocation to shoots seems to be limited (e.g., Binet et al., 2000). Terrestrial soil PAHs are probably less available to terrestrial root systems than are aquatic sediment PAHs to aquatic rooted plants (e.g., McGlynn & Livingston, 1997).
Animals (earthworms: Lumbricus spp., pill bugs: Armadillarium and Porcellia spp., mealworm larvae: Tenebrio molitor, gray crickets: Acheta domesticus, garden snails: Helix pomata, and a vole: Microtus canicaudus) kept in the terrestrial microcosm mentioned above were found to have taken up 0.8% and 1.2% of the labelled phenanthrene and acenaphthene, respectively, applied to wood. Soil-dwelling and litter-feeding species (pill bugs and earthworms) showed higher concentrations than crickets or snails residing above-ground and feeding on vegetation. The vole had high concentrations of 14C in the gastrointestinal tract, but also in the brain, suggesting some systemic intake (Gile et al., 1982; see also section 4.3.2).
Field observations also indicated uptake of creosote-derived PAHs by aquatic organisms. Elevated levels (see section 5.1.6) have been detected, for example, in molluscs and crustaceans taken from creosote-treated pilings (Shimkin et al., 1951; Dunn & Stich, 1976) and in (mostly sediment-associated) invertebrates and fish captured from creosote-contaminated areas in fresh waters (Black et al., 1981; DeLeon et al., 1988; Pastorok et al., 1994) and marine environments (Zitko, 1975; Malins et al., 1985; Rostad & Pereira, 1987; Elder & Dresler, 1988).
Relocation experiments with oysters and clams and laboratory studies with fish confirmed the uptake (and accumulation) of PAHs following creosote exposure (see section 4.3.1). An increase in PAH bile metabolites has been detected in fish (rainbow trout, Oncorhynchus mykiss) from a 28-day creosote microcosm study, indicating some uptake (and metabolism) (Karrow et al., 1999). Extracts of oysters (Crassostrea virginica) exposed to the water-soluble fraction of creosote-contaminated sediment and the corresponding sediment extracts showed similar profiles of organic compounds (Hale & Aneiro, 1997).
A transfer primarily of the lipophilic creosote constituents (or their metabolites) to the human food supply is possible and has been documented in some cases (e.g., for shellfish and fish; see sections 5.1.4 and 5.1.6). Some transfer to livestock is also likely via contact of farm animals with creosote-treated farm buildings or fences or when creosote is used as a general disinfectant (Oehme & Barrett, 1986); however, measurements of tissue burdens of animals affected (see section 9) were not available.
Compared with the many studies with individual components of creosote, relatively little is known of the biotransformation and biodegradation of creosote constituents when they are present in the creosote mixture.
Creosote is not easily degraded by microorganisms (see Tables 7 and 8), consistent with its use as a wood preservative (see section 3) and with field monitoring results (see section 5).
Table 7: Survey on laboratory investigations of aerobic degradation of creosote (under simulated conditions as expected in situ).a
|
Inoculum |
Starting creosote materialb |
Components monitored |
Conditions |
Duration |
Main trends for removal (R)c |
Reference |
|
|
Mixed consortium from c-c soil |
Environmental (waste, 11 PAHs quantified, 0.7–830 µg/g soil) |
11 PAHs |
Microcosm (Kidman sandy loam + 1% creosote waste); 20 °C, dark, tilling at 2- to 3-week intervals) |
>4 months |
R: Mean t½ values (days): |
Keck et al. (1989) |
|
|
Mixed consortium from c-c soil |
Environmental (groundwater) |
42 compounds |
Shake flask (+ nutrients), 30 °C, dark |
14 days |
R: 100%, phenolics; 99%, low-molecular-weight PAHs; |
Mueller et al. (1991a) |
|
|
Mixed consortium from c-c soil |
Environmental plus m-cresol (0.5–104 µg/g soil) |
m-cresol |
Microcosm |
28 days |
R: 22.6% mineralization |
Evanshen et al. (1992) |
|
|
Mixed consortium from tap water and soil |
Artificial (n = 25), MAHs, PAHs, HACs, phenolics |
25 compounds |
Clayey till column, 11–13 °C (+NO3–, +O2); flow rate: 1570 ml/day |
40 days |
No complete R of any compound |
Broholm et al. (1999b) |
|
|
Mixed consortium from c-c groundwater |
Environmental |
12 compounds |
Bottle, no further details |
7 months |
9/12 compounds still present |
Thomas et al. (1989) |
|
|
14C-labelled naphthalene, phenanthrene, or methylnaphthalene |
14CO2 |
Bottle, dark, 24 °C |
8–19 days |
R: <40% (no degradation with inocula from pristine sites) |
|||
|
Mixed consortium from c-c groundwater |
Artificial, 10 HACs (0.4–4 mg/litre) |
10 HACs |
Microcosm (groundwater), dark, 10 °C, magnetic stirrer |
846 days |
Stepwise R: |
Dyreborg et al. (1997) |
|
|
Mixed consortium from c-c aquifer material |
14C-labelled phenanthrene |
14CO2 |
Flask shaken, |
56 days |
Partial R: 14% mineralization |
Mohammed et al. (1998) |
|
|
Creosote enrichment culture from c-c sediment |
Original (6 PAHs quantified: 0.87–3.7 µmol/litre) |
6 PAHs |
Batch vial, shaken, dark |
7 days |
Complete R: naphthalene |
Lehto et al. (2000) |
|
|
a |
Abbreviations used: c-c = creosote-contaminated; HAC = heterocyclic aromatic compound; k = biodegradation rate; MAH = monocyclic aromatic hydrocarbon; PAH = polycyclic aromatic hydrocarbon; R = removal; t½ = half-life. |
|
b |
Refers mainly to three categories: original, environmental, artificial mixture (simple or complex). |
|
c |
Refers to degradation or transformation, corrected for abiotic losses. |
Table 8: Survey on laboratory investigations of anaerobic degradation of creosote (under simulated conditions as expected in situ).a
|
Inoculum |
Starting creosote materialb |
Components monitored |
Conditions |
Duration |
Main trends for removal (R)c |
Reference |
|
Mixed consortium from c-c groundwater and aquifer |
Environmental |
Phenolic and heterocyclic compounds (4–20d), |
Microcosm, methanogenic; °C n.sp. |
300 days |
Three-step sequential R: |
Godsy et al. (1992) |
|
Mixed consortium from c-c groundwater |
Environmental plus artificial |
MAHs, naphthalene, |
Batch microcosm; 10 °C, 20 °C; nitrate-reducing (n), |
7–12 months |
R: |
Flyvbjerg et al. (1993) |
|
Mixed consortium from c-c groundwater |
Artificial, 10 HACs (0.4–4 mg/litre each) |
10 HACs |
Microcosm (groundwater), |
846 days |
R of 2/10 HACs: |
Dyreborg et al. (1997) |
|
Mixed consortium from c-c creekbed sediment |
Artificial; 16 PAHse |
PAHs, CH4, ion reduction |
Batch; 25 °C; Tween added; methanogenic (m), nitrate-reducing (n), sulfidogenic (s) |
Up to 1 year |
Partial R: m: all bicyclic PAHs, 1 tricyclic PAH (anthraquinone); n: 2-methylanthracene; s: none |
Sharak Genthner et al. (1997) |
|
Mixed consortium from c-c aquifer |
See above |
See above |
See above |
See above |
No R of any PAHs tested |
|
a |
Abbreviations used: c-c = creosote-contaminated; DMP = dimethylphenol; HAC = heterocyclic aromatic compound; MAH = monocyclic aromatic hydrocarbon; n.sp. = not specified; PAH = polycyclic aromatic hydrocarbon; R = removal. |
|
b |
Refers mainly to three categories: original, environmental, artificial mixture (simple or complex). |
|
c |
Refers to degradation or transformation, corrected for abiotic losses. |
|
d |
Initial concentrations in mg/litre. |
|
e |
Naphthalene, 2-methylnaphthalene, 1-methylnaphthalene, biphenyl, 2,6-dimethylnaphthalene, acenaphthene, fluorene, phenanthrene, anthracene, 2-methylanthracene, anthraquinone, fluoranthene, pyrene, 2,3-benzo[b]fluorene, chrysene, BaP. |
|
f |
Initial total nominal concentration in mg/litre. |
Table 9: Groundwater contamination by creosote: sum concentrations.a
|
Country/site |
Components |
Concentrations (mg/litre) |
Measure |
Reference |
|
Canada |
||||
|
Five wood treatment/storage sites |
total PAHs (n = n.sp.) |
1.9–303 |
range of maxima |
CEPA (1993) |
|
Denmark |
||||
|
Three sites contaminated by creosote (gasworks or asphalt) |
total MAHs (9) |
n.d.–6.8 |
range (n = 11) |
Johansen et al. (1997) |
|
Three sites contaminated by creosote (gasworks or asphalt) |
heterocycles: |
|
maxima |
Johansen et al. (1998) |
|
USA |
||||
|
St. Louis Park, Minnesota, former creosoting facility (50 years of operation), municipal water supply wells (four sites) |
total PAHs (20) |
0.0005–0.004 |
range of averages |
Hickok et al. (1982) |
|
St. Louis Park, Minnesota, former creosoting facility (50 years of operation), aquifer near plant site; s: 1981 |
phenolic compounds |
30 |
maximum |
Ehrlich et al. (1982) |
|
Pensacola, Florida, near American Creosote Works (1902–1981); s: 1984 |
total PAHs (12) |
25.12 |
maxima (six sites) |
Goerlitz et al. (1985) |
|
Pensacola, Florida, near American Creosote Works (1902–1981); s: n.sp. |
total PAHs (12) |
8.0 |
maxima (five sites, |
Pereira & Rostad (1986) |
|
Pensacola, Florida, near American Creosote Works (1902–1981); s: 1983 |
total nitrogen heterocycles (9) |
26.98 |
maxima (five sites, six depths) |
Pereira et al. (1987) |
|
Pensacola, Florida, American Creosote Works (1902–1981), on-site monitoring well; s: n.sp. |
total PAHs (20) |
1419 |
average |
Mueller et al. (1993)b |
|
Pensacola, Florida, American Creosote Works (1902–1981), 1 well; s: 1991 |
total organics (41) |
570.37 |
n = 1 |
Middaugh et al. (1994a)b |
|
a |
Abbreviations used: MAH = monocyclic aromatic hydrocarbon; n.d. = not detected; n.sp. = not specified; PAH = polycyclic aromatic hydrocarbon; s = sampling year. |
|
b |
The elevated concentration of creosote components detected in these studies may be reflective of the sample preparation methodologies used. |
Increased concentrations of methane found in some creosote-contaminated aquifers suggested that some anaerobic degradation was occurring (e.g., Ehrlich et al., 1982; Goerlitz et al., 1985). Products of aerobic degradation have also been identified at some creosote-contaminated sites (e.g., Pereira et al., 1988; Johansen et al., 1998).
The extent of microbial degradation of creosote is difficult to determine because of the large number of chemicals present in the original or environmentally fractionated mixtures and the large variability in concentration ratios.
The individual creosote constituents together cover a wide range of microbial degradability or recalcitrance. For details, see reviews or other publications on MAHs (e.g., Barker et al., 1987; Barbaro et al., 1992; Rippen, 1999), PAHs (e.g., Cerniglia & Heitkamp, 1989; Cerniglia, 1992; Mueller et al., 1996; IPCS, 1998; Juhasz & Naidu, 2000; Kanaly & Harayama, 2000), HACs (e.g., Grbic-Galic, 1989; Kuhn & Suflita, 1989; Dyreborg et al., 1996a; Licht et al., 1996; Bianchi et al., 1997; Bressler et al., 1998; Fetzner, 1998), or phenolic compounds (e.g., Arvin et al., 1991; Nielsen & Christensen, 1994; IPCS, 1995).
However, extrapolations from studies with single substances are of limited value, because many interactions between the individual components are possible. Most interactions observed were degradation inhibiting, but there were also promoting effects on the degradation of co-substances in a few cases (Arvin et al., 1988, 1989; Bouchez et al., 1995; Millette et al., 1995, 1998; Dyreborg et al., 1996b,c; Lantz et al., 1997; Broholm et al., 1999b; Lotfabad & Gray, 2002).
Therefore, in this context, mainly studies using simple or complex mixtures of creosote constituents as test material (i.e., artificial, environmental, original mixtures) have been considered. A survey of the results of bacterial aerobic (Keck et al., 1989; Thomas et al., 1989; Mueller et al., 1991a; Evanshen et al., 1992; Dyreborg et al., 1997; Mohammed et al., 1998; Broholm et al., 1999b; Lehto et al., 2000) or anaerobic (Godsy et al., 1992; Flyvbjerg et al., 1993; Dyreborg et al., 1997; Sharak Genthner et al., 1997) degradation studies modelling (more or less sophisticated) natural in situ conditions is given in Tables 7 and 8, respectively. Despite the great complexity of creosote degradation processes, some general trends can be observed. The majority of components are not completely degradable under simulated natural conditions, even with (in situ adapted) inocula from creosote-contaminated sites. Aerobic degradation proceeds more quickly than anaerobic degradation (e.g., Dyreborg et al., 1997). Phenolic compounds are relatively easily degraded. Within PAHs, degradability appears to be inversely related to the number of aromatic rings. Some HACs were quickly degraded or disappeared (e.g., quinoline), whereas others (e.g., pyrrole) were rather recalcitrant. Most studies monitored only the disappearance of the compounds, so it is often not clear if there was biotransformation rather than complete mineralization.
Besides structural features of the chemicals, a series of other factors influence the degradation/transformation of creosote constituents in situ — for example, bioavailability (e.g., with respect to sorption phenomena, trapping in pore water, etc.), initial concentration, and nutrient or oxygen supply (Fetzner, 1998; Johansen et al., 1998; Broholm et al., 1999b; Breedveld & Sparrevik, 2000; Juhasz et al., 2000a). It is assumed that in typical creosote-contaminated groundwater compartments, the oxygen concentration will often not be sufficient for complete biodegradation (Lee & Ward, 1985; Wilson et al., 1986; Broholm et al., 1999b). Biodegradation rates of some PAHs have been found to be enhanced transiently by pre-irradiation (Lehto et al., 2000). Microbial adaptation to some creosote compounds also occurred (Wilson et al., 1986).
There is a great variety in microbial metabolic pathways of creosote compounds, but they all involve the incorporation of oxygen into the ring structure, ring cleavage, and the production of intermediates with specific breakdown patterns (Gibson & Subramanian, 1984; Pereira et al., 1987, 1988; Arvin et al., 1988; Miller & Comalander, 1988; Wilson & Jones, 1993; Chapman et al., 1995; Mueller et al., 1996; Licht et al., 1997; Fetzner, 1998; Johansen et al., 1998; Bressler & Fedorak, 2000). In some cases, the intermediates formed can be more persistent (mobile or toxic) than their parent compounds, as has been found, for example, for quinoline/quinolinone (Fetzner, 1998), acenaphthene / several acenaphthene oxidation products (Selifonov et al., 1998), and some other PAH metabolites (Singleton, 1994).
Because of the numerous sites with creosote contamination (mainly soils, groundwater), many efforts have been undertaken to develop useful remediation strategies. Generally, there are three basic approaches. One method involves the removal of contaminated soil and its treatment on-site (prepared bed, etc.) or in a slurry reactor under conditions optimal for microbial growth; inocula used can be native or specifically enriched (Mueller et al., 1989, 1991b,c; Borazjani et al., 1990; Ellis et al., 1991; Davis et al., 1993; Otte et al., 1994; Glaser & Lamar, 1995; Brooks et al., 1998; Guerin, 1999; Eriksson et al., 2000). In another technique used for treating groundwater, the contaminated water is pumped to the surface, where it can be treated aerobically and thereafter recycled (to nearby surface waters) (Mahaffey et al., 1989; Mueller et al., 1993; Middaugh et al., 1994b). The third method involves procedures to promote in situ biodegradation — for example, by adding nutrients, electron acceptors, adapted microorganisms, and sometimes surfactants or other materials, such as manure, straw, compost, or sewage sludge, to the soil (e.g., Ellis et al., 1991; Evanshen et al., 1992). Creosote-contaminated groundwaters have been treated in similar ways (Dust & Thompson, 1973). Frequently, a combination of several strategies is used for remediation — including physical or chemical methods such as encapsulating, washing (plus surfactants), and sorption (Tobia et al., 1994; Zapf-Gilje et al., 2001; Bates et al., 2002; Rasmussen et al., 2002).
In many cases, it has been possible to achieve significant reductions for certain substances. However, advantages seem to be limited. Primarily the high-molecular-weight PAHs continued to be recalcitrant in treated soil (e.g., Mueller et al., 1991b,c; Davis et al., 1993; Glaser & Lamar, 1995; Breedveld & Karlsen, 2000; Breedveld & Sparrevik, 2000). Despite the removal of a majority of creosote contaminants from groundwater through biotreatment, only a slight decrease in toxicity and teratogenicity (see section 9) of biotreated groundwater was observed (Mueller et al., 1991a). A study in which creosote-contaminated groundwater was treated with a sorption/bio-barrier (peat/sand barrier material under aerobic conditions) found trimethylphenols to be the most difficult to remove (Rasmussen et al., 2002). Some constraints connected with bioremediation of creosote-contaminated soils have been reviewed in detail (Wilson & Jones, 1993; Pollard et al., 1994; Alexander, 2000; Juhasz et al., 2000b; Reid et al., 2000). A recent study (Brooks et al., 1998) demonstrated that several treatments have been successful in reducing, for example, the total PAH concentration in contaminated soils, but actually increased the microbial mutagenicity of these soils; an analysis indicated that the mutagenic fraction contained azaarenes, a substance class that was often not included in monitoring programmes. Other experiments showed accumulations of PAH metabolites/ degradation products, such as 9H-fluorenone, 4-hydroxy-9H-fluorenone, 9,10-phenanthrenedione, and 4H-cyclopenta[def]phenanthrenone (Eriksson et al., 2000).
Bacteria involved in degradation of creosote components (some PAHs, HACs, phenolic compounds) have been isolated and identified as belonging mostly to the genera of Pseudomonas or Sphingomonas (Drisko & O’Neill, 1966; Ehrlich et al., 1983; Bennett et al., 1985; Rothenburger & Atlas, 1990; Chapman et al., 1995; Grifoll et al., 1995; Lantz et al., 1997; Selifonov et al., 1998; Eriksson et al., 2000; Leblond et al., 2001) and Mycobacterium (Grosser et al., 1995). Lignin-degrading fungi such as Phanerochaete sordida, P. chrysosporium, and Pleurotus ostreatus have also been found to be capable of transforming several creosote PAHs (Glaser, 1990; Davis et al., 1993; Glaser & Lamar, 1995; Eggen & Majcherczyk, 1998).
Little is known about the transformation of creosote by other organisms. Generally, the most striking feature seems to be that PAH components are transformed more rapidly in fish than in several invertebrate species (NRCC, 1983; IPCS, 1998). Mostly, these PAH metabolites are not routinely detected (Meador et al., 1995). The occurrence of PAH metabolites in fish after controlled creosote exposure has been reported only rarely (Karrow et al., 1999). Formation of PAH–DNA adducts in fish is addressed in section 6.6. Transformation results for mammals are available only from studies with laboratory mammals (see section 6).
Photochemical transformation seems to be the most important abiotic mechanism by which creosote constituents, such as PAHs, HACs, and phenolic compounds, are transformed in the atmosphere and, to a lesser extent, in water and soil. Indirect photolysis (photo-oxidation, involving peroxyl, hydroxyl, and other radicals) appears to prevail over direct photolysis. Half-lives measured (mostly in single-component studies with and without reference to creosote) varied widely (0.2 h –550 days), depending on test conditions and compounds (e.g., NRCC, 1983; IPCS, 1995 [review on cresols], 1998 [review on PAHs and HACs]). There are few data on transformation products. Several oxygenated compounds have been observed, as well as nitroPAHs and nitro-cresols (e.g., Andersson & Bobinger, 1992; Kochany & Maguire, 1994; IPCS, 1995, 1998).
Little information is available on photodegradation of creosote components when present in the creosote mixture. Irradiation (arc xenon lamp, aqueous media) of six PAHs separately or of these PAHs in creosote (initial PAH concentrations / duration: 0.61–3.1 µmol/litre / 5–30 min or 0.55–4.4 µmol/litre / 10 min, respectively) resulted in the following photodegradation rates (% separately / in mixture): naphthalene (57/47.6), acenaphthene (47/50), fluorene (48.4/29.3), phenanthrene (91.7/6.82), anthracene (83.6/29.1), and pyrene (38.3/8.64). With one exception (acenaphthene), there was a trend of decreased photoreactivity in the mixture compared with the individual tests; this was explained by the competition of light absorption in the presence of co-occurring compounds. The photochemical products detected by GC-MS seemed to be quinone derivatives of the original compounds (Lehto et al., 2000).
For the purpose of remediation of creosote- and PCP-contaminated waters, laboratory-scale experiments using the photo-Fenton reaction, which employs ferric ion (Fe3+), hydrogen peroxide, and UV light, have been conducted. Saturated aqueous solutions of creosote/PCP (American creosote-P2) were treated by the photo-assisted Fenton reaction (1 mmol Fe3+/litre; 10 mmol hydrogen peroxide/litre; black lamp UV light; pH: 2.75; 25 °C), and the disappearance of 36 identified creosote compounds and PCP was monitored during a 180-min reaction period. The following order of reactivity was found: two-ring PAHs > heterocyclics > phenolics (including PCP) > three-ring PAHs > four- and five-ring PAHs. Within 5 min, the concentrations of 18 of the 37 compounds declined to values at or below their detection limits; 13 compounds were at least 90% transformed, but six PAHs (phenanthrene, fluoranthene, 2,3-benzo[b]fluorene, chrysene, benzo[b]fluoranthene, and BaP) resisted to a greater extent. By 180 min, a more extensive transformation was observed, except for chrysene and BaP (showing 70–80% transformation). No new peaks were observed in MS chromatograms, and added 14C-phenanthrene and 14C-pyrene were mineralized by 93% and 35%, respectively; about 33% of the organic nitrogen was converted to inorganic nitrogen-containing compounds, accompanied by an undetermined yield of sulfate. Concomitantly, the acute toxicity of the treated solution to fish and water flea (see section 9) was reduced (Engwall et al., 1999). Another method using photocatalysis (near-UV irradiation in the presence of titanium dioxide) appeared to achieve total mineralization of creosote in water (separate phase; 100 or 360 mg creosote/litre, Armor Coat, commercial domestic grade, Canada), as demonstrated by changes in absorbance or reflectance and/or carbon dioxide evolution; intermediate products were not monitored (Serpone et al., 1994). A single-component photolysis study with BaP (using hydrogen peroxide and UV light and additional analytical methods) detected a series of polar BaP photoproducts, including methoxy, hydroxy, and dihydroxy isomers of BaP and even more polar compounds (Miller et al., 1988).
Abiotic hydrolysis is considered not to be a significant environmental degradation process for PAHs (IPCS, 1998) and phenolic compounds (IPCS, 1995). Similar conclusions may be valid for HACs.
Field monitoring studies showed that aquatic organisms such as invertebrates (Shimkin et al., 1951; Zitko, 1975; Dunn & Stich, 1976; Black et al., 1981; Malins et al., 1985; Rostad & Pereira, 1987; DeLeon et al., 1988; Elder & Dresler, 1988) and fish (Black et al., 1981; Malins et al., 1985; Pastorok et al., 1994) living at creosote-contaminated sites have absorbed PAHs (and heterocyclic compounds) typical of creosote at concentrations above reference values (see section 5.1.4).
Characteristic differences between invertebrate and vertebrate species have been pointed out by the field study of Black et al. (1981). Insects and crayfish (Procambarus sp.) had much higher levels of phenanthrene, 1,2-benzanthracene, and BaP than most of the fish (brown trout, Salmo trutta; white sucker, Catostomus commersoni). An exception was lamprey (Lampetra sp.), which appeared to accumulate high levels of phenanthrene (a 3.5-fold increase compared with sediments). Generally, PAH profiles in insects and crayfish were close to that found in the sediments, whereas fish had greatly altered ratios for low/high-molecular-weight PAHs (see also section 5.1.4).
Relocation experiments with mollusc and crustacean species also indicated accumulation of PAHs. Oysters (Crassostrea virginica; total n = about 60) sampled from an industrially non-impacted site (Piatatank River, USA) were exposed in situ to PAH-contaminated sediments near a creosote facility on the Elizabeth River (Virginia, USA). Within 3 days of exposure, the concentrations of several measured PAHs (benz[a]anthracene/chrysene, benzofluoranthenes, BaP, fluoranthene, phenanthrene, pyrene) increased from non-detectable to as much as 11.7 mg/kg dry weight; they then stabilized during the 15-day observation period (Pittinger et al., 1985). Similarly, oysters (n = 5 per group) introduced for a 6-week period into an estuarine environment near a creosote contamination site (Pensacola, Florida, USA) showed a significant increase of phenanthrene, fluorene, and pyrene (diagram only) in soft tissues, whereas naphthalene was not accumulated. Minimum BCFs relative to sediments have been estimated to be in the range of 0.3–1.0 for phenanthrene and fluoranthene (Elder & Dresler, 1988). Clams (Rangia cuneata; n = 3–4 per group) translocated from a relatively pristine site to a bayou (Bayou Bonfouca, USA) flowing over a creosote spill site showed gradual increases of several PAHs in their shucked bodies over a 4-week period; the most pronounced increase was seen for benzopyrenes, from pre-exposure (background) levels of 87 µg/kg wet weight to 132 µg/kg wet weight after 2 weeks and 600 µg/kg wet weight after 4 weeks (DeLeon et al., 1988). Accumulation of PAHs in newly moulted and intermoult crustaceans (blue crab, Callinectes sapidus) has been examined in the Elizabeth River (USA) near a creosote spill site. Paired premoult and intermoult crabs (n = 9–12 per group) were placed in baskets for approximately 3 days (until ecdysis was completed). The mean total PAH concentrations (cyclopenta[def]phenanthrene, fluoranthene, pyrene) in hepatopancreas and muscle increased from non-detectable levels to significant burdens in both stages, with higher concentrations in newly moulted crabs (hepatopancreas/muscle: 9560/1380 µg/kg dry weight) than in intermoult crabs (3360/498 µg/kg dry weight). Low-molecular-weight compounds such as acenaphthene, dibenzofuran, fluorene, and phenanthrene were present in both control and exposed crabs (Mothershead & Hale, 1992).
Adult lobsters (Homarus americanus; n = n.sp.) exposed to creosote (no specification) at concentrations ranging from 0.3 to 2.5 mg/litre during a laboratory lethality test showed considerably higher values of "creosote" in their hepatopancreas than the control lobsters (3220–47 500 mg/kg lipid versus 670 mg/kg lipid; as indicated by fluorescence measurements). The residues increased with the test concentrations (0.3, 1.3, 2.5 mg/litre) as well as with exposure time (up to 120 h) at the 0.3 mg/litre exposure, which was the non-lethal concentration (McLeese & Metcalfe, 1979). Guppies (Poecilia reticulata) kept in the laboratory in aquaria that contained a sediment layer taken from a creosote-contaminated small drainage stream had significant residues of several PAHs (acenaphthene, anthracene, benz[a]anthracene, benzo[b]fluoranthene, benz[k]fluoranthene, BaP, chrysene, fluoranthene, phenanthrene, pyrene) in their tissues (composite samples of carcasses without liver; n = n.sp.) 43 days after exposure. Naphthalene and fluorene were not detected in the fish tissue, although they were present along with the other PAHs in sediment and water (Schoor et al., 1991). In a microcosm study, livers of rainbow trout (Oncorhynchus mykiss; n = 10) contained 4 of 16 individual PAHs scanned for, but there was no relationship to creosote dose after 28 days of exposure. This lack was thought to be partly due to rapid metabolism in fish prior to analytical detection (Whyte et al., 2000).
BCFs in connection with creosote exposure have rarely been determined; there is an estimate for oysters and sediment (see above: Elder & Dresler, 1988). Recently, biota–sediment accumulation factors (BSAFs) of several PAHs have been determined for a creosote-contaminated lake in Finland. Duck mussels (Anodonta anatina) were exposed to sediment for 10 months (1998–1999) by caging at four experimental sites. The BSAFs derived from concentrations of PAHs (acenaphthene, phenanthrene, anthracene, fluoranthene, pyrene, and benz[a]anthracene) in sediment (on an organic matter basis) and in duck mussel tissue (on a lipid weight basis) varied from 0.79 to 1.45. The highest BSAF (1.45) was calculated for benz[a]anthracene (Hyötyläinen et al., 2002). Values from other studies for some creosote constituents, such as PAHs and heterocyclic or phenolic compounds, have been compiled elsewhere (e.g., Lu et al., 1978; Southworth et al., 1978, 1980; Veith et al., 1980; Eastmond et al., 1984; Sundström, et al., 1986; IPCS, 1995, 1998). They vary over a wide range, depending on compound, aquatic species, and test conditions — for example, BCFs (organism/water in wet weight; IPCS, 1998) for naphthalene: 19.3–10 844 (measured in crustaceans), 2.2–320 (measured in fish); or for BaP: 458–73 000 (measured in crustaceans), 12.5–4900 (measured in fish). Generally, equilibrium concentration factors increased with increasing molecular weight (or with log Kow) within a compound group. Some sulfur-containing heterocycles have been found to be bioconcentrated to a greater extent than their PAH counterparts — for example, naphthalene and benzo[b]thiophene showed BCFs of 50 and 750, respectively, in Daphnia magna (Eastmond et al., 1984). Accumulation may also be influenced by the presence of co-substances. Studies with anthracene showed that BCFs in fish (rainbow trout, Oncorhynchus mykiss) differed during single-compound and complex-mixture (oil shale retort water) exposures (Linder et al., 1985).
Biomagnification of creosote PAHs within aquatic food-chains appears to be limited as far as fish are involved, because vertebrates generally have a more effective metabolic capacity for these compounds than invertebrates (e.g., NRCC, 1983).
Only few data are available on bioaccumulation of creosote constituents in the terrestrial environment following creosote exposure.
In a microcosm experiment with creosote containing 14C-labelled acenaphthene and phenanthrene, an accumulation (ecological magnification) factor between a grey-tailed vole (Microtus canicaudus) and soil has been determined. The calculations (mg/kg of 14C equivalents in vole / mg/kg of 14C equivalents in soil) resulted in factors of 12 for phenanthrene and 31 for acenaphthene (Gile et al., 1982).
The ultimate fate of creosote components is largely dependent on the physicochemical properties of the components, matrix properties, the presence of degrading/accumulating organisms, and environmental conditions. Components may be distributed to the atmosphere (the more volatile fraction), leached to water and soil (compounds with high solubilities), with the potential for migration, or sorbed onto soil or sediment particles (compounds with high Kow). Movement of sediment-sorbed creosote components may also occur through transport of colloidal material. Some creosote components are readily degradable via biotic (aerobic and anaerobic) and abiotic processes; however, many high-molecular-weight compounds are recalcitrant and may persist in the environment for decades. Degradation of creosote components often leads to the formation of transformation products (i.e., the compounds are not mineralized), which may be more toxic and mobile than the parent compounds. There is also the potential for marine and terrestrial organisms to bioaccumulate creosote components; however, this is dependent on the bioavailability of the compounds, the organisms’ mode of feed, and metabolism.
For high-molecular-weight PAHs, which are the most persistent creosote components, sediments and soils are the major environmental sinks (IPCS, 1998), consistent with creosote-related findings discussed previously (sections 4.1–4.3). However, the possibility for redistribution processes should be noted. Additionally, groundwater is an important sink for many creosote components (see section 5).
There are only a few specific measurements of the thermal decomposition of creosote or creosoted wood (Marutzky, 1990; Becker, 1997; see also section 2). For example, combustion of creosoted wood in a small incinerator resulted in elevated emission values (carbon monoxide, nitrogen oxides, hydrocarbons) compared with untreated wood (Marutzky, 1990). Analyses for PCDDs/PCDFs in a laboratory-scale combustion experiment gave (preliminary) positive results (Becker, 1997). Because a multiplicity of undesired combustion products may be generated, it is recommended that creosoted residues be incinerated only in a licensed high-temperature incinerator (UNEP, 1995; HSDB, 1999). In particular, dioxins, which are formed during waste incineration processes in the temperature range between 250 and 650 °C, require high temperatures (~1000 °C) for destruction (e.g., Tuppurainen et al., 1998).
The reuse of creosoted railway ties or telephone poles, etc., in children’s playgrounds or other public or private places is now restricted in many countries (RPA, 2000).
The contribution of creosote to environmental contamination in highly industrialized regions is difficult to assess because there are releases of PAHs from many other sources. However, profile and concentration gradients of creosote components in relation to creosote point sources are helpful markers.
The choice of PAHs to be quantified in research and environmental policy as indicators for pollution or health risk assessment depends on the purpose of the investigation, and there is no international agreement. The US EPA (1984b) proposed 16 PAHs as "priority pollutant PAHs," and these are often taken as a reference list for analysis of various environmental matrices. Some countries have their own lists of "priority PAHs" (IPCS, 1998). For example, a group of 10 PAHs is used by the Dutch Ministry of Environment (BKH, 1995), and a group of 11 PAHs is used by the United Kingdom Health and Safety Executive (see Table 4). Sometimes only the three most abundant PAHs (pyrene, phenanthrene, and fluoranthene) are recorded.
Typically, contamination by creosote has been traced by monitoring selected PAHs, but occasionally HACs (NSO) have also been determined.
Generally, there is great variability in the concentrations of the various creosote components, depending, for example, on the varying composition of original creosotes, the amount of creosote released, distance from the source, and the degree of weathering (combined influence of dissolution/adsorption, volatilization, and degradation; see also section 4) of the creosote.
There are few data available for ambient air and surface water matrices, partly reflecting the difficulties in relating the volatile or water-soluble components of creosote to their source. Stationary matrices such as sediment and soil are the best indicators of creosote contamination due to the association of many characteristic creosote components with organic matter (see section 4). Creosote constituents frequently reach groundwater, which remains enriched with low-molecular-weight aromatics, including benzene, toluene, xylenes, naphthalene, and phenolic and heterocyclic compounds.
Metabolites from the degradation of creosote are not usually included in routine analyses of creosote-contaminated samples.
There are few data concerning ambient atmospheric concentrations of creosote-derived compounds; these refer to PAHs from creosote point sources — for example, in the vicinity of creosote facilities.
Fluoranthene concentrations near a creosoting firm in the Netherlands were reported to be 64 ng/m3 at a distance of 500 m, which decreased to 7.2 and 1.6 ng/m3 at 2000 m and 5000 m, respectively. At 2000 m from the creosoting company, the following PAHs were present: naphthalene (90 ng/m3), phenanthrene (44.6 ng/m3), fluoranthene (7.2 ng/m3), and anthracene (2.2 ng/m3) (Slooff et al., 1989). In another study, measured and calculated BaP concentrations in air at a distance of 100, 200, and 2000 m from a creosoting plant were given (without details) as 2–5 ng/m3, 0.5–1.5 ng/m3, and 0.6 ng/m3, respectively (BKH, 1995). Occasionally, neighbouring residents of creosote facilities have complained about odour nuisance (and irritated mucous membranes) (BKH, 1995).
A survey on outdoor concentrations of selected PAHs (including BaP) from other or undefined sources is given by IPCS (1998).
Indoor air concentrations measured at workplaces are compiled in section 5.3.
Creosote-related compounds have been detected in groundwater samples near former gasworks and creosoting facilities in Canada, Denmark, and the USA. They include MAHs (e.g., benzene, toluene, xylenes), PAHs (e.g., naphthalene, methylnaphthalene, phenanthrene, anthracene, fluorene, pyrene, chrysene, BaP), and phenolic and heterocyclic compounds. A survey is given in Table 9 (showing sum concentrations) and Tables 10–12 (showing individual concentrations). Highest concentrations have been found in on-site monitoring wells of a former creosote works (Pensacola, Florida, USA), with average concentrations of 1419 mg/litre for total PAHs, 178 mg/litre for total heterocycles, and 0.77 mg/litre for total phenolics (Mueller et al., 1993; see also Table 9). The average concentration for BaP was 37.6 mg/litre (Mueller et al., 1993; see also Table 10). In this study, the elevated concentrations of total PAHs, total heterocycles, and BaP may be reflective of the sample preparation methodologies used. Monitoring data from 44 Danish creosote sites showed concentrations (90th percentiles) of 30 µg/litre for BaP and 50 µg/litre for chrysene (Kiilerich & Arvin, 1996; see also Table 10). Highest concentrations of several individual heterocyclic compounds (e.g., carbazole, dibenzofuran, dibenzothiophene, quinoline/quinolinone) were in the order of 10–80 mg/litre (see Table 11). Within monocyclic aromatic and phenolic compounds, a maximum of 25 mg/litre was reported for m/p-cresol (see Table 12).
Table 10: Groundwater concentrations of non-heterocyclic PAHs detected at creosote-contaminated sites.
|
Compound |
Groundwater concentrationsa (µg/litre) |
||||||||
|
(1) |
(2) |
(3) |
(4) |
(5) |
(6) |
(7) |
(8) |
(9) |
|
|
Acenaphthene |
139 760 |
30 800 |
805 |
||||||
|
Acenaphthylene |
760 |
14 770 |
1 520 |
59 |
|||||
|
Anthracene |
360 |
70 |
81.4 |
60 850 |
3 830 |
425 |
|||
|
Anthraquinone |
19 420 |
3 980 |
|||||||
|
Benz[a]anthracene |
38 950 |
6 010 |
280 |
||||||
|
Benzo[a]fluorene |
|||||||||
|
Benzo[b]fluorene |
35 990 |
4 900 |
|||||||
|
Benzofluoranthenes |
|||||||||
|
Benzo[b]fluoranthene |
8 000 |
11 910 (+ k)b |
3 760 (+ k)b |
121 |
|||||
|
Benzo[k]fluoranthene |
|||||||||
|
Benzo[ghi]perylene |
|||||||||
|
Benzo[a]pyrene |
0.27 |
4 000 |
0.32 |
30 |
37 580 |
2 800 |
57 |
||
|
Benzo[e]pyrene |
|||||||||
|
Biphenyl |
225 |
360 |
2 270 |
5 670 |
|||||
|
Chrysene |
0.67 |
50 |
37 580 |
7 920 |
249 |
||||
|
Dibenzo[a,h]anthracene |
<0.1 |
||||||||
|
1,7-Dimethylnaphthalene |
37.8 |
||||||||
|
2,3-Dimethylnaphthalene |
8 810 |
1 820 |
|||||||
|
2,6-Dimethylphenanthrene |
19 420 |
6 040 |
|||||||
|
Fluoranthene |
230 860 |
45 050 |
1 028 |
||||||
|
Fluorene |
160 |
130 |
293 |
610 |
141 330 |
26 620 |
661 |
||
|
Indeno[1,2,3-cd]pyrene |
3 200 |
||||||||
|
2-Methylanthracene |
74 330 |
9 670 |
|||||||
|
1-Methylfluorene |
354 |
||||||||
|
Methylnaphthalenes |
820 |
||||||||
|
1-Methylnaphthalene |
614 |
790 |
13 330 |
29 110 |
|||||
|
2-Methylnaphthalene |
1 263 |
1 400 |
2 860 |
563 |
|||||
|
1-Methylphenanthrene |
11 460 |
||||||||
|
Naphthalene |
7 500 |
66 000 |
2.8 |
8 600 |
3 490 |
15 600 |
1 110 |
83 220 |
3 312 |
|
Perylene |
|||||||||
|
Phenanthrene |
700 |
214 |
780 |
356 760 |
100 920 |
1 825 |
|||
|
Pyrene |
94 |
171 130 |
27 040 |
666 |
|||||
|
a |
(1) Near former tar distillation plant, Ontario, Canada, maximum values (Raven & Beck, 1992). |
|
(2) Near six wood treatment/storage sites across Canada, maximum values (CEPA, 1993). |
|
|
(3) Near wood-preserving plant, New Castle, New Brunswick, Canada, maximum values (CEPA, 1994). |
|
|
(4) Forty-four sites near gasworks, asphalt factories, and wood preservation plants, Denmark, 90th percentiles (Kiilerich & Arvin, 1996). |
|
|
(5) Near abandoned wood treatment facility, Texas, USA, maximum values (Bedient et al., 1984). |
|
|
(6) Near creosote works, Pensacola, Florida, USA, maximum values (Goerlitz et al., 1985). |
|
|
(7) Near creosote works, on-site, Pensacola, Florida, USA, average (Mueller et al., 1993). |
|
|
(8) Near creosote works, Pensacola, Florida, USA, single measurement (Middaugh et al., 1994a). |
|
|
(9) Near five wood treatment facilities across USA, average (Rosenfeld & Plumb, 1991). |
|
|
b |
+ k = + benzo[k]fluoranthene. |
Table 11: Groundwater concentrations of heterocyclic compounds detected at creosote-contaminated sites.
|
Compound |
Groundwater concentrationsa (µg/litre) |
|||||||||
|
(1) |
(2) |
(3a) |
(3b) |
(4) |
(5) |
(6) |
(7) |
(8) |
(9) |
|
|
Nitrogen-containing heterocycles |
||||||||||
|
9-Acridinone |
105 |
0.005 |
21 |
|||||||
|
Acridine |
13 |
55 |
0.012 |
106 |
1.4 |
4 110 |
2 290 |
|||
|
Alkylpyridines, other |
110 |
|||||||||
|
Alkylquinolines, other |
86 |
|||||||||
|
Carbazole |
150 |
299 |
570 |
30 420 |
4 510 |
|||||
|
2,4-Dimethylpyridine |
27 |
7.7 |
||||||||
|
1-Hydroxyisoquinoline |
1 150 |
6 900 |
||||||||
|
2-Hydroxy-4-methylquinoline |
450 |
1 100 |
||||||||
|
2-Hydroxyquinoline |
270 |
42 000 |
||||||||
|
Indole |
83 |
|||||||||
|
Isoquinoline |
1 800 |
29 |
1 310 |
100 |
5 400 |
|||||
|
Isoquinolinone |
4 172 |
|||||||||
|
1-Methylpyrrole |
n.d.b |
|||||||||
|
2-Methylpyridine |
57 |
41 |
490 |
7 220 |
||||||
|
2-Methylquinoline |
50 |
21 |
297 |
|||||||
|
4-Methylquinoline |
857 |
590 |
1 620 |
|||||||
|
Pyrrole |
0.22 |
|||||||||
|
Quinoline |
45 |
11 200 |
288 |
60 |
11 420 |
|||||
|
Quinolinone |
9 987 |
|||||||||
|
Sulfur-containing heterocycles |
||||||||||
|
Alkylthiophenes |
6.5 |
|||||||||
|
Benzothiophene |
99 |
669 |
1 360 |
1 320 |
2 480 |
|||||
|
Benzothiophene-2,3-dione |
<2.5 |
182.6 |
||||||||
|
Dibenzothiophene |
5.1 |
9.4 |
55 980 |
6 450 |
||||||
|
Dibenzothiophene-sulfone |
0.27 |
|||||||||
|
Thiophene |
9.2 |
|||||||||
|
Oxygen-containing heterocycles |
||||||||||
|
Benzofuran |
16 |
|||||||||
|
Dibenzofuran |
31 |
424.7 |
204 |
490 |
84 420 |
22 530 |
332 |
|||
|
Methylbenzofurans |
11 |
|||||||||
|
a |
(1) Near old gasworks and wood treatment facilities, Denmark, maximum values (Johansen et al., 1998). |
|
(2) Near abandoned wood treatment facility, Texas, USA, maximum values (Bedient et al., 1984). |
|
|
(3) Near former creosote facility, Florida (a) and Minnesota (b), USA, means (Ondrus & Steinheimer, 1990). |
|
|
(4) Near former creosote facility, Florida, USA, statistical value not specified (Pereira et al., 1983). |
|
|
(5) Near former creosote facility, Florida, USA, maximum values (Pereira & Rostad, 1986; Pereira et al., 1987). |
|
|
(6) Near creosote works, Pensacola, Florida, USA, maximum values (Goerlitz et al., 1985). |
|
|
(7) Near creosote works, on-site, Pensacola, Florida, USA, average (Mueller et al., 1993). |
|
|
(8) Near creosote works, Pensacola, Florida, USA, single measurement (Middaugh et al., 1994a). |
|
|
(9) Near five wood treatment facilities across USA, average (Rosenfeld & Plumb, 1991). |
|
|
b |
n.d. = not detected. |
Table 12: Groundwater concentrations of monocyclic aromatic and phenolic compounds detected at creosote-contaminated sites.
|
Compound |
Groundwater concentrationsa (µg/litre) |
|||||||
|
(1) |
(2) |
(3) |
(4) |
(5) |
(6) |
(7) |
(8) |
|
|
Monocyclic aromatic compounds |
||||||||
|
Benzene |
900 |
8 400 |
3 500 |
33 |
||||
|
p-Dichlorobenzene |
32.6 |
|||||||
|
Ethylbenzene |
39 |
|||||||
|
Toluene |
150 |
1 200 |
48 |
|||||
|
1,2,3-Trimethylbenzene |
46.7 |
|||||||
|
Xylenes |
110 |
1 400 |
1 670 |
94 |
||||
|
Phenolic compounds |
||||||||
|
Cresols |
3 200 |
|||||||
|
o-Cresol |
650 |
6 660 |
||||||
|
m-Cresol |
780 |
100 |
25 170 (+ p)b |
|||||
|
p-Cresol |
n.d.c |
|||||||
|
2,3-Dimethylphenol |
50 |
1 050 |
||||||
|
2,4-Dimethylphenol |
150 |
5 650 |
||||||
|
2,5-Dimethylphenol |
150 |
3 040 |
||||||
|
2,6-Dimethylphenol |
n.d. |
900 |
||||||
|
3,4-Dimethylphenol |
n.d. |
2 200 |
||||||
|
3,5-Dimethylphenol |
220 |
9 520 |
||||||
|
2-Methylphenol |
7 100 |
1 268 |
||||||
|
3-Methylphenol |
13 730 |
|||||||
|
4-Methylphenol |
6 170 |
3 640 |
||||||
|
Naphthol |
1 190 |
|||||||
|
Phenol |
2 000 |
3 300 |
10 400 |
50 |
11 470 |
1 537 |
||
|
Trimethylphenol |
20 |
1 910 |
||||||
|
Xylenols |
4 100 |
600 |
9 380 |
|||||
|
a |
(1) Near former gasworks, Denmark, statistical value not specified (Flyvbjerg et al., 1993). |
|
(2) Near abandoned wood treatment facility, USA, maximum values (Bedient et al., 1984). |
|
|
(3) Near former tar distillation plant, Canada, maximum values (Raven & Beck, 1992). |
|
|
(4) Forty-four sites near gasworks, asphalt factories, and wood preservation plants, Denmark, 90th percentiles (Kiilerich & Arvin, 1996). |
|
|
(5) Near creosote works, Pensacola, Florida, USA, maximum values (Goerlitz et al., 1985). |
|
|
(6) Near creosote works, on-site, Pensacola, Florida, USA, average (Mueller et al., 1993). |
|
|
(7) Near creosote works, Pensacola, Florida, USA, single measurement (Middaugh et al., 1994a). |
|
|
(8) Near five wood treatment facilities across USA, average (Rosenfeld & Plumb, 1991). |
|
|
b |
+ p = + p-cresol. |
|
c |
n.d. = not detected. |
Mean total PAH concentrations in municipal water supply wells near a former creosote facility (including a distillation plant) in the USA ranged from 0.5 to 4 mg/litre; individual PAH concentrations are not given (Hickok et al., 1982; see also Table 9).
A comparison of groundwater analyses from 44 Danish creosote sites showed that the highest concentrations found for most of the creosote constituents were of the same order of magnitude as the calculated solubilities found in the literature. Exceptions were chrysene and BaP concentrations, which were 1–2 orders of magnitude higher than their solubilities. The reason for this was not given (Kiilerich & Arvin, 1996).
It has been estimated that 80% of the (diffuse) PAH pollution of surface waters (from small waterways) in the Netherlands originates from creosote-treated banks (BKH, 1995). Occasionally, films of creosote oil have been identified in small Dutch waterways in which creosoted wood was being placed for bank protection (BKH, 1995) or in a small river near an abandoned US wood treatment facility (Black, 1982). During the application of creosoted bank protection in a small Dutch waterway, BaP concentrations of 1.3 µg/litre were measured; concentrations of other PAHs were not reported (BKH, 1995).
None of the nine PAHs monitored was detected in river water samples taken downstream from a wood treatment facility in Pensacola, Florida, USA (detection limit not specified; probably 30 µg/litre), despite high PAH concentrations in sediments and biota (Elder & Dresler, 1988); however, it should be noted that many PAHs are difficult to detect in surface waters due to adsorption and other phenomena (see also section 4).
On the other hand, PAHs have been detected in river water (Bayou Bonfouca, Lousiana, USA) from an area that remained contaminated following a creosote spill (fire at a wood products treatment plant) 10 years previously. Eight PAHs were monitored (at one control and three "contaminated" sites) — for example, naphthalene (up to 14.1 mg/litre), fluorene (up to 12.3 mg/litre), phenanthrene (up to 155 mg/litre), and BaP (up to 6.6 mg/litre) (Catallo & Gambrell, 1987). Monitoring of 12 PAHs in water samples of a drainage stream near a creosote works (Pensacola, Florida, USA) resulted in total concentrations of up to 153 µg/litre, with BaP concentrations of up to 0.05 µg/litre (Schoor et al., 1991). Total PAH concentrations (16 PAHs) in railway ditch water flowing to salmon streams (British Columbia, Canada) did not exceed 1 µg/litre at four sampling points, but reached maxima of 122 µg/litre and 3516 µg/litre at two sites where creosote-treated power/ telecommunication line poles were erected in the ditches (mean: 606.9 µg/litre; n = 6). Maximum BaP and chrysene concentrations were 2.5 µg/litre and 441 µg/litre, respectively (Wan, 1991; see also Table 13). Data on additional creosote-derived individual PAHs detected in surface waters are listed in Table 13.
Table 13: Surface water concentrations of PAHs detected at creosote-contaminated sites.
|
Compound |
Surface water concentrationsa,b (µg/litre) |
|||
|
(1) |
(2) |
(3) |
(4) |
|
|
Acenaphthene |
5.4–33 |
0.6–49.2 |
||
|
Acenaphthylene |
0.1–2.6 |
|||
|
Anthracene |
400–39 700 |
0.05–6.55 |
2.7–55.4 |
|
|
Benz[a]anthracene |
n.d.–0.11 |
11.5–182 |
||
|
Benzofluoranthenes |
n.d.–5500 |
|||
|
Benzo[b]fluoranthene |
tr.–0.02 |
11.8–141 |
||
|
Benzo[k]fluoranthene |
0.001–0.02 |
6.2–78 |
||
|
Benzo[ghi]perylene |
9.1–15.3 |
|||
|
Benzo[a]pyrene |
300–6600 |
0.005–0.05 |
n.d.–2.5 |
1.3 |
|
Chrysene |
n.d.–0.05 |
15.4–441 |
||
|
Dibenzo[a,h]anthracene |
1.7–2.3 |
|||
|
Fluoranthene |
1200–110 000 |
0.14–1.7 |
20–1226 |
|
|
Fluorene |
600–12 300 |
1–7.15 |
0.6–68.8 |
|
|
Indeno[1,2,3-cd]pyrene |
12.5–31.4 |
|||
|
Naphthalene |
700–14 100 |
5.3–153 |
0.3–0.8 |
|
|
Phenanthrene |
2300–155 000 |
0.15–6.04 |
7.9–488 |
|
|
Pyrene |
2100–85 000 |
0.26–2.7 |
19.4–733 |
|
|
a |
(1) River Bayou Bonfouca, USA; range (Catallo & Gambrell, 1987). |
|
(2) Small drainage stream, Pensacola, USA; range (Schoor et al., 1991). |
|
|
(3) Railway ditch water, near creosote-treated power/telecommunication line poles erected in ditches, British Columbia, Canada; range (Wan, 1991). |
|
|
(4) Small waterways, The Netherlands; statistical value not specified (BKH, 1995). |
|
|
b |
Abbreviations used: n.d. = not detected; tr. = trace. |
For associated sediment concentrations, see Tables 14 and 15.
Table 14: Sediment contamination by creosote: sum concentrations.a
|
Location |
Compounds |
Concentrations |
Measure |
Reference |
|
Coastal estuarine sediments |
||||
|
Canada, British Columbia, Belcarra Bay, near creosoted pilings |
total PAHs |
<0.02–19.7 |
range (at 40 m and 3 m) |
Vijayan & Crampton (1994) |
|
Canada, near creosoted wharf: |
total PAHs (up to 16) |
|
ranges (1–50 m distance, various depths) |
Gagne et al. (1995) |
|
USA, Eagle Harbor, Puget Sound, Washington, near wood-creosoting facility (in operation since the late 1800s) |
total AHs (29) |
2.8–120 |
range of means from three sites (total n = 15) |
Malins et al. (1985) |
|
total AHs (29) |
1300 |
n = 1 |
||
|
total NCACs (>200) |
~100 |
n = 1 |
||
|
total AHs (29) |
310 |
1 site |
Krahn et al. (1986) |
|
|
total PAHs (n = n.sp.) |
1100–29 000 |
range (3 sites) |
Krone et al. (1986) |
|
|
total NCACs (>200) |
200–1250 |
range (3 sites) |
||
|
total PAHs (13) |
6461 |
n = 1 |
Swartz et al. (1989) |
|
|
USA, Elizabeth River, Virginia, Southern Branch, highly industrialized area including creosote wood treatment plants; two massive spills of wood preservatives |
total PAHs (14) |
1.2–170 |
range (n = 28 stations) |
Bieri et al. (1986) |
|
total PAHs (n = n.sp.) |
10.9–259.4 |
range of means for four stations |
Koepfler & Kator (1986) |
|
|
total PAHs (n = n.sp.) |
400–13 000c |
range (one site, two depths) |
Huggett et al. (1987) |
|
|
total PAHs (21) |
21 200 |
mean (n = 2) |
Roberts et al. (1989) |
|
|
total PAHs (n = n.sp.) |
3–2200 |
range (n = 3 stations) |
Vogelbein et al. (1990) |
|
|
total PAHs (>21) |
15 000 |
maximum (n = 225) |
Huggett et al. (1992) |
|
|
USA, Arthur Kill, New Jersey, highly industrialized area including creosote wood-preserving industries (1960s–1970s), s: 1991 |
total PAHs (17–19) |
1.7–139 |
range of means (five stations) |
Huntley et al. (1993) |
|
Continental water sediments |
||||
|
Canada, Thunder Bay, Ontario, harbour (Lake Superior) adjacent to a wood-preserving plant |
total PAHs (16) |
0.69–4330 |
range (n = 24) |
McKee et al. (1990) |
|
total PAHs (n = n.sp.) |
26 388 |
maximum (n = n.sp.) |
CEPA (1993) |
|
|
Canada, Newcastle, New Brunswick, |
total PAHs (12) |
3.6–11 000 |
range (n = 14) |
Kieley et al. (1986) |
|
Canada, Truro, Nova Scotia, discharge stream / Salmon River |
total PAHs (12) |
1.5–6300 |
range (n = 14) |
Kieley et al. (1986) |
|
Canada, British Columbia, railway ditch |
total PAHs (16) |
1.89–1169 |
range |
Wan (1991) |
|
The Netherlands, two waterways: |
total PAHs (3) |
|
n.sp. |
BKH (1995) |
|
Finland, Lake Jämsänvesi, near creosote impregnation plant (in operation: 1956–1976) |
total PAHs (16) |
8–3294 |
range (n = 9; |
Hyötyläinen & Oikari (1999a) |
|
Sweden, River Angermanälven, site 3, near creosote impregnation plant (in operation: 1947–1968) |
total PAHs (up to 20) |
48–1968 |
range (n = n.sp.) |
Ericson et al. (1999) |
|
a |
Abbreviations used: AH = aromatic hydrocarbon; NCAC = nitrogen-containing aromatic compound; n.sp. = not specified; PAH = polycyclic aromatic hydrocarbon; s = sampling year, if specified. |
|
b |
Unless otherwise specified. |
|
c |
Weight basis not clearly specified. |
Table 15: Sediment concentrations of PAHs and heterocyclic compounds detected at creosote-contaminated sites.
|
Compound |
Sediment concentrationsa (mg/kg dry weight) |
||||||||||||||
|
(1) |
(2) |
(3) |
(4) |
(5) |
(6) |
(7) |
(8) |
(9) |
(10) |
(11) |
(12) |
(13) |
(14) |
(15) |
|
|
Acenaphthene |
0.04–5 |
890 |
810 |
0.26–34.0 |
5–19 |
107 |
0.02–12.7 (2.7) |
5.8–24.6 |
|||||||
|
Acenaphthylene |
86 |
0.36–3.40 |
0.03–0.99 (0.3) |
n.d.b–4.8 |
|||||||||||
|
Anthracene |
0.1–12 |
280 |
1300 |
0.26 |
0.61–31.0 |
3–140 |
23 |
107–1650 |
0.03–40.6 (8.0) |
1124 |
9.5–734 |
2.7 |
|||
|
Benz[a]anthracene |
0.1–5.2 |
160 |
11 |
140 |
0.35 |
0.30–12.0 |
5–15 |
12 |
590 |
0.02–42.7 (7.9) |
n.d.–12.7 |
0.94 |
|||
|
Benzo[a]fluorene |
120 |
0.29 |
|||||||||||||
|
Benzo[b]fluorene |
120 |
0.28 |
0.21 |
||||||||||||
|
Benzofluoranthenes |
0.3–3 |
17 |
110 |
0.23 |
75–2280 |
||||||||||
|
Benzo[b]fluoranthene |
64 |
0.29–8.70 |
3.2 |
120 |
<0.08–13.9 (3.0) |
632 |
n.d.–0.22 |
||||||||
|
Benzo[k]fluoranthene |
27 |
14 |
0.20–9.30 |
4.1 |
69 |
<0.1–7.1 (1.4) |
n.d.–1250 |
0.30 |
|||||||
|
Benzo[ghi]perylene |
0.2–0.7 |
0.03 |
0.33–2.80 |
97 |
0.14–2.2 (0.7) |
0.13 |
|||||||||
|
Benzo[a]pyrene |
0.2–2.1 |
34 |
9 |
50 |
0.10 |
0.31–11.0 |
7.8 |
40–610 |
190 |
0.11–9.1 (2.3) |
450 |
20.0–358 |
0.45 |
2.3 |
|
|
Benzo[e]pyrene |
0.3–2 |
6 |
56 |
0.08 |
120 |
0.25 |
|||||||||
|
Biphenyl |
0.01–0.4 |
0.09 |
|||||||||||||
|
Chrysene |
0.3–7.8 |
150 |
19 |
0.32 |
0.39–14.0 |
7–10 |
6.2 |
290 |
0.06–59.5 (11.4) |
n.d.–42.1 |
1.0 |
||||
|
Dibenzo[a,h]anthracene |
0.02–0.4 |
2.5 |
0.69–1.20 |
0.16–0.77 (0.3) |
n.d. (0.31–144)c |
||||||||||
|
2,6-Dimethylnaphthalene |
0.01–0.7 |
n.d.–438 |
|||||||||||||
|
2,6-Dimethylphenanthrene |
n.d.–0.6 |
||||||||||||||
|
Fluoranthene |
0.3–25 |
1000 |
42 |
1000 |
2.37 |
0.59–66.0 |
17–62 |
28 |
608–6580 |
2300 |
0.3–523 (91.3) |
6.5 |
|||
|
Fluorene |
0.04–6.6 |
730 |
1000 |
1.25 |
0.74–17.0 |
3–32 |
32 |
358–7720 |
0.04–116 (20.3) |
n.d.–295 |
12 |
||||
|
Indeno[1,2,3-cd]pyrene |
0.1–1.2 |
18 |
0.03 |
0.30–33.0 |
48 |
0.13–1.7 (0.6) |
14.3–453 |
0.15 |
|||||||
|
1-Methylfluorene |
0.31–74.9 |
||||||||||||||
|
1-Methylnaphthalene |
0.01–1.4 |
n.d. |
|||||||||||||
|
2-Methylnaphthalene |
0.02–1.7 |
0.03 |
0.46–22.0 |
||||||||||||
|
1-Methylphenanthrene |
0.01–1.2 |
1.1 |
|||||||||||||
|
3-Methylphenanthrene |
2.5 |
||||||||||||||
|
Naphthalene |
0.2–3.6 |
460 |
1300 |
0.1 |
0.37–54 |
0.2–0.3 |
45 |
1380–7720 |
0.09–1.1 (0.5) |
7654 |
|||||
|
Perylene |
0.05–0.5 |
14 |
0.05 |
n.d.–14.3 |
0.24 |
||||||||||
|
Phenanthrene |
0.2–19 |
2000 |
25 |
2430 |
4.22 |
0.36–89 |
n.d.–12 |
103 |
435–29 310 |
5600 |
0.2–204 (36.7) |
5687 |
15 |
||
|
Pyrene |
0.3–18 |
580 |
28 |
1.35 |
0.17–27.0 |
11–32 |
66 |
178–1660 |
1700 |
0.2–135 (26.1) |
n.d.–188 |
3.8 |
|||
|
2,3,5-Trimethylnaphthalene |
n.d.–0.6 |
n.d. |
|||||||||||||
|
Heterocycles |
|||||||||||||||
|
Carbazole |
n.d.–1.7 |
18 |
0.34–2.50 |
||||||||||||
|
Dibenzofuran |
0.03–3.6 |
0.48–6.0 |
|||||||||||||
|
Dibenzothiophene |
0.35 |
||||||||||||||
|
a |
(1) Coastal harbour sediments, USA, means (Malins et al., 1985). |
|
(2) Coastal harbour sediments, USA, n = 1 (Swartz et al., 1989); heterocycles: Krone et al. (1986). |
|
|
(3) Subestuarine (Elizabeth River) sediment, USA, statistical value not specified (Bieri et al., 1986). |
|
|
(4) Estuarine (Elizabeth River) sediment, USA, maxima (Huggett et al., 1987, 1992). |
|
|
(5) Estuarine (Elizabeth River) sediment, USA, mean (Roberts et al., 1989). |
|
|
(6) Estuarine river (Arthur Kill) sediment, USA, range (Huntley et al., 1993). |
|
|
(7) Estuarine drainage stream sediment, Pensacola, USA, range (Elder & Dresler, 1988). |
|
|
(8) Estuarine drainage stream sediment, Pensacola, USA, single measurement (Schoor et al., 1991). |
|
|
(9) Bayou Bonfouca sediment, USA, range, weight basis not specified (Catallo & Gambrell, 1987). |
|
|
(10) Ditch sediments from two wood-preserving facilities, Canada, maximum values (Kieley et al., 1986). |
|
|
(11) Ditch sediments adjacent to a railway right-of-way, Canada, range (mean) (Wan, 1991). |
|
|
(12) Near six wood treatment/storage sites across Canada, maximum values (CEPA, 1993). |
|
|
(13) Lake Jämsänvesi sediment, Finland, range, 0–10 cm depth (Hyötyläinen & Oikari, 1999a). |
|
|
(14) River sediment adjacent to a wood treatment facility, Sweden, combined sample from three sites (Ericson et al., 1999). |
|
|
(15) Sediment from small waterways with creosoted bank protection, The Netherlands, maximum value (BKH, 1995). |
|
|
b |
n.d. = not detected. |
|
c |
10–30 cm depth. |
Table 16: Soil contamination by creosote: sum concentrations.a
|
Location |
Compounds |
Concentrations |
Measure |
Reference |
|
Australia (southeastern), former creosoting plant area (in operation for 30 years), |
total PAHs (16) |
2200 |
maxima |
Guerin (1999) |
|
total PAHs (16) |
3–501 |
ranges |
||
|
Canada, nine wood treatment/storage sites |
total PAHs |
89.5–520 000 |
range of maxima |
CEPA (1993) |
|
Canada, Quebec, two wood-preserving industrial sites: |
total PAHs (16) |
means |
Otte et al. (1994) |
|
|
- soil 1 (Tracy) |
919c |
|||
|
Denmark, playground sand from four sandboxes made of old railway sleepers |
total PAHs (9) |
n.d.–1.8 |
range |
Danish EPA (1996) |
|
Finland, creosote-treated poles (after 2, 4, and 10 years in service, 1978–1988) |
"creosote oil contents" |
|
Nurmi (1990) |
|
|
- around the poles |
25 000–90 000 |
(n = >20) |
||
|
Finland, wood treatment plant |
total PAHs |
>2000 |
n.sp. |
Priha et al. (2001) |
|
Finland, storage area for railway ties; s: 1992–1993 |
total PAHs (19) |
<0.002–19.5 |
range (n =19; different depths at nine sites) |
Sandell & Tuominen (1996) |
|
Norway, Lilleström, creosote wood-preserving activity for >50 years: |
total PAHs (16) |
Breedveld & Sparrevik (2000) |
||
|
- top soil |
6280 |
n.sp. |
||
|
Sweden, Stockholm, creosote production site (1861–1917); s: ~1990 |
total PAHs (11) |
<10–32 000 |
range |
|
|
total phenols |
<1–98 |
range |
Ellis et al. (1991) |
|
|
Sweden, close to creosoted posts |
total PAHs (7) plus dibenzofuran |
<1–1500 |
range |
Bergqvist & Holmroos (1994) |
|
USA (southeastern); eight wood-treating plant sitesd |
total PAHs (16) |
n.d.–196c |
range |
Borazjani et al. (1990) |
|
USA, creosote waste site |
total PAHs |
5749 |
n.sp. |
Baud-Grasset et al. (1993) |
|
USA, Louisiana, Slidell, wood preservation facility (1892–1970; destroyed by fire in 1970): |
Acharya & Ives (1994) |
|||
|
- surface/near-surface soils |
total PAHs (~15) |
1–15 680c |
n.sp. |
|
|
USA, Montana, Libby site; |
total PAHs (~17) |
524 |
single |
Mohammed et al. (1998) |
|
a |
Abbreviations used: n.d. = not detected; n.sp. = not specified; s = sampling year, if specified. |
|
b |
Unless otherwise specified. |
|
c |
Weight basis not clearly specified. |
|
d |
Slightly contaminated areas (chosen for remediation). |
High concentrations of PAHs have been found in coastal or estuarine as well as in continental water sediments near creosote sources. A survey is given in Table 14 (sum concentrations) and Table 15 (individual concentrations). Total PAH maxima of about 20 000–30 000 mg/kg dry weight or more have been detected in the vicinity of wood-preserving facilities (Krone et al., 1986; Catallo & Gambrell, 1987; Roberts et al., 1989; CEPA, 1993). Heterocyclic compounds were also present (see Table 14), with maxima of about 1300 mg/kg dry weight for total nitrogen-containing aromatic compounds, for example (Krone et al., 1986).
Waterway and river banks in the Netherlands have been protected from erosion by creosoted wood. As a result, elevated PAH concentrations have been found in the sediments — for example, 5.5 mg/kg dry weight (for three PAHs: pyrene, phenanthrene, and fluoranthene) compared with 0.18 mg/kg dry weight in waterways without creosoted bank protection (BKH, 1995). Total PAH concentrations of up to 20 mg/kg dry weight (Vijayan & Crampton, 1994) or 1200 mg/kg dry weight (Wan, 1991) have been recorded in connection with other wooden creosoted constructions (see also Table 14).
BaP concentrations as high as several hundred mg/kg dry weight have been measured in sediments near wood-preserving facilities. Values of about 1–2 orders of magnitude lower occurred in sediments adjacent to creosoted banks or railway rights-of-way (see Table 15). Concentrations of more than 20 other individual PAHs and some heterocyclic compounds are given in Table 15.
Generally, there is a great variation in contaminant concentrations, showing patchiness and "hot spots."
Elevated concentrations of creosote-derived compounds have been documented in soils near abandoned facilities that had produced or used creosote in Australia (Guerin, 1999), Canada (CEPA, 1993; Otte et al., 1994), Finland (Priha et al., 2001), Norway (Breedveld & Sparrevik, 2000), Sweden (Ellis et al., 1991; Eriksson et al., 2000), and the USA (Bedient et al., 1984; Thomas et al., 1989; Borazjani et al., 1990; Acharya & Ives, 1994; Mohammed et al., 1998), as well as in the vicinity of creosote-treated wooden constructions, such as poles in service (Nurmi, 1990; Bergqvist & Holmroos, 1994; BKH, 1995), railway sleepers (railroad ties) (Sandell & Tuominen, 1996), or sandboxes made of old railway sleepers (Danish EPA, 1996). A survey is given in Table 16 (sum concentrations) and Table 17 (individual concentrations). Maximum sum concentrations of PAHs ranging from 90 to 520 000 mg/kg dry weight have been reported from wood treatment/storage sites in Canada (CEPA, 1993). A maximum of 32 000 mg total PAHs/kg dry weight was found at a creosote production site in Sweden, which had not been in operation for more than 70 years. Total phenols amounted to 98 mg/kg dry weight (Ellis et al., 1991). Similarly high concentrations of "creosote oil contents" (up to 90 000 mg/kg dry weight) were present in soil samples taken around creosote-treated poles (Nurmi, 1990). Analyses of playground sand from sandboxes made of old impregnated railway ties found total PAH concentrations of up to 1.8 mg/kg dry weight. This maximum was measured in samples from surface sand in close contact with the wood. Maximum values of about 0.4 mg/kg were detected both at 20 cm depth in close contact with the wood and in surface sand 0.5 m distant from the wood (Danish EPA, 1996).
Table 17: Soil concentrations of PAHs and heterocyclic compounds detected at creosote-contaminated sites.
|
Compound |
Soil concentrationsa (mg/kg dry weight) |
||||||||||
|
(1) |
(2) |
(3) |
(4) |
(5) |
(6) |
(7) |
(8) |
(9) |
(10) |
(11) |
|
|
PAHs |
|||||||||||
|
Acenaphthene |
32.1 (100) |
<0.05 |
n.d.b–1.9 |
7.2 (1.5) |
5300 |
559 |
|||||
|
Acenaphthylene |
<0.5 |
<0.05 |
5 (0.9) |
635.1 |
85 |
||||||
|
Anthracene |
8.0 (9.8) |
1910 |
<0.05–0.07 |
n.d.–65 |
14 (2.7) |
2.16 |
5400 |
678 |
|||
|
Benz[a]anthracene |
5.3 |
10 (1.1) |
1200 |
312 |
|||||||
|
Benzo[b]fluoranthene |
2.2 (6.5) |
500 |
1.56 |
7.2 (0.9) |
340 |
||||||
|
Benzo[k]fluoranthene |
1.6 (4) |
0.70 |
1 (0.1) |
550 |
|||||||
|
Benzo[ghi]perylene |
0.6 (1.7) |
1.6 (0.2) |
60 |
||||||||
|
Benzo[a]pyrene |
2.0 (4.9) |
390 |
<0.05–0.20 |
0.53 |
0.35–6.1 |
2.8 (0.4) |
490 |
||||
|
Benzo[e]pyrene |
0.94 |
||||||||||
|
Biphenyl |
0.79 |
||||||||||
|
Chrysene |
4 (27) |
n.d.–520 |
11 (1.3) |
1119 |
|||||||
|
Dibenzo[a,h]anthracene |
0.3 (1) |
240 |
|||||||||
|
1,4-Dimethylnaphthalene |
2.5 (0.4) |
||||||||||
|
1,7-Dimethylnaphthalene |
1.89 |
||||||||||
|
Fluoranthene |
55.9 (150) |
<0.05–0.71 |
5.41 |
n.d.–2500 |
70 (9.8) |
6600 |
1056 |
||||
|
Fluorene |
12.6 (27) |
<0.05 |
0.02 |
n.d.–66 |
15 (1.8) |
4.22 |
5600 |
489 |
|||
|
9H-Fluorenone |
28 (2.8) |
||||||||||
|
Indeno[1,2,3-cd]pyrene |
0.7 (2.3) |
2.3 (0.3) |
|||||||||
|
1-Methylfluorene |
0.47 |
||||||||||
|
1-Methylnaphthalene |
2.06 |
||||||||||
|
2-Methylnaphthalene |
3.42 |
7.7 |
6100 |
257 |
|||||||
|
Naphthalene |
16.9 (52) |
2058 |
<0.05 |
0.01 |
1.3 (0.2) |
3.74 |
17.3 |
23 226 |
|||
|
Phenanthrene |
71.1 (149) |
7200 |
<0.05–0.05 |
0.21 |
n.d.–75 |
66 (15) |
18.3 |
16 000 |
1090 |
||
|
9,10-Phenanthrenedione |
17 (2.3) |
||||||||||
|
Pyrene |
30.8 (55) |
<0.05–0.82 |
4.66 |
n.d.–1800 |
51 (6.1) |
4600 |
865 |
||||
|
Heterocycles |
|||||||||||
|
Dibenzofuran |
n.d.–50 |
3.76 |
4500 |
358 |
|||||||
|
Dibenzothiophene |
1.18 |
||||||||||
|
a |
(1) Australia, excavated soil, near former creosoting plant, means (maxima in parentheses) (Guerin, 1999). |
|
(2) Canada, near seven wood treatment/storage sites, maximum values (CEPA, 1993). |
|
(3) Denmark, playground sand from four sandboxes made of old railway ties, 0–20 cm depths, ranges (Danish EPA, 1996). |
|
|
(4) Finland, storage area for railway ties, various sites (9) and depths (0–2 m), maximum values (Sandell & Tuominen, 1996). |
|
|
(5) The Netherlands, near creosoted posts placed 45 years ago; reference value: 0.08 mg/kg (BKH, 1995). |
|
|
(6) Sweden, soil close to three creosoted posts after 40 years of exposure, various depths (25–90 cm), ranges (Bergqvist & Holmroos, 1994). |
|
|
(7) Sweden, creosote-contaminated soil from a former gasworks site, means (standard deviation in parentheses) (Eriksson et al., 2000). |
|
|
(8) USA, Texas, near former creosote facility (1952–1972); sampling: 1983; 0.2–0.5 m (Bedient et al., 1984). |
|
|
(9) USA, Texas, near former creosote facility, 2.0–2.2 m (Thomas et al., 1989). |
|
|
(10) USA, Louisiana, near fire-destroyed former creosote facility (maximum values; weight basis not clearly specified) (Acharya & Ives, 1994). |
|
|
(11) USA, creosote waste site (location, statistical value, and weight basis not clearly specified) (Baud-Grasset et al., 1993). |
|
|
b |
n.d. = not detected. |
BaP concentrations found in soils near wood treatment/storage sites reached maxima of 390 mg/kg dry weight (CEPA, 1993), those near creosoted posts, 6.1 mg/kg (BKH, 1995), and those from playground sand, 0.2 mg/kg (Danish EPA, 1996). For soil concentrations of additional PAHs and some heterocyclic compounds, see Table 17.
Several PAHs have been identified in wood preservative sludge at very high concentrations, ranging from 300 mg/kg (benzo[j]fluoranthene) to 26 000 mg/kg (fluoranthene); the BaP content was found to be 3600 mg/kg (NRCC, 1983; weight basis and statistical value not specified).
Creosote-derived contamination of food has been documented mostly for fish and seafood from contaminated rivers or estuaries or from their containment in creosote-contaminated impoundment.
Fish and other aquatic animals captured from creosote-contaminated areas have been found to contain creosote-typical PAHs (see Table 18) and in some cases (fish) PAH metabolites (see section 5.1.6). Many of the animals analysed belong to edible and commercially and recreationally important species. In field experiments, newly moulted crabs, which are regarded as a seafood delicacy, have been demonstrated to accumulate significant amounts of high-molecular-weight PAHs originating from creosote (Mothershead & Hale, 1992; see also section 4.3.1).
Table 18: Concentrations of PAHs and heterocyclic compounds in aquatic fauna from creosote-contaminated sites.a
|
Environment; creosote source |
Species |
PAHs, |
Concentrations (µg/kg) |
Remarks |
Reference |
|
|
Creosote-contaminated |
Control |
|||||
|
Freshwater (small river); downstream (and upstream = control) of a creosote spill site, Michigan, USA |
insects (mostly Trichoptera larvae) |
phen |
w: 5489 |
42 |
n = n.sp. |
Black et al. (1981) |
|
crayfish (Procambarus sp.) |
phen |
w: 447 |
6 |
composite samples of 10–25 |
||
|
lamprey |
phen |
w: 15 313 |
35 |
n = 3 or more |
||
|
brown trout (Salmo trutta) |
phen |
w: 38 |
2 |
n = 3 or more |
||
|
white sucker |
phen |
w: 28 |
4 |
n = 3 or more |
||
|
Freshwater (wood treatment, no details, Calgary, Alberta, Canada) |
insects |
phen |
w: 520 |
n.d. |
composite sample (no details) |
CEPA (1993) |
|
fish (n.sp.) |
phen |
w: 30 |
n.d. |
composite sample (no details) |
||
|
Freshwater (river); near wood treatment facility |
large-scale sucker |
total |
n.sp. (slightly elevated compared with controls) |
details in special report |
Pastorok et al. (1994) |
|
|
Bayou; near creosote spill site (creosote works) (and control bayou) |
marsh clam |
benzopyrenes |
w: up to 600 |
87 |
n = 3–4/site (caged at three sites) |
DeLeon et al. (1988) |
|
Marine; collected from creosoted pilings, California, USA |
barnacles (Tetraclita squamosa rubescens) |
benzopyrene |
present |
n.d. |
n = n.sp. |
Shimkin et al. (1951) |
|
Marine; wharf periodically repaired with creosote-treated timber (New Brunswick, Canada) |
mussel (Mytilus edulis) |
"creosote" |
l: 1 046 000 |
n.sp. |
n = n.sp. |
Zitko (1975) |
|
periwinkle |
l: 3 254 000 |
n.sp. |
||||
|
whelks |
l: 354 000 |
n.sp. |
||||
|
Marine; creosoted pilings or timbers |
mussels |
BaP |
w: up to 215 |
dropped off |
n = n.sp. |
Dunn & Stich (1976) |
|
Marine; creosote-contaminated sediments (Eagle Harbor, Washington, USA) (and control site) |
fish, English sole |
total |
d: ~1000 |
~100 |
liver (composite sample of 4–6) |
Malins et al. (1985) |
|
invertebrates |
total |
50 000, 84 000 |
~500 |
n = 2 (composite stomach samples) |
||
|
e.g.: |
up to |
up to |
||||
|
Estuarine, Elizabeth River, Virginia, USA; creosote and other industries |
oyster (Crassostrea virginica) |
total (6), |
d: 3900 |
n.d. |
n = n.sp. |
Pittinger et al. (1985) |
|
Estuarine (Pensacola Bay, Florida, USA); near wood-preserving facility |
snail (Thais haemastoma) |
PAHs (12) |
w: 0.7–194 |
n.sp. |
n.sp. |
Rostad & Pereira (1987) |
|
NSOs (7) |
w: 0.1–9.7 |
|||||
|
Estuarine (Pensacola Bay, Florida, USA); near wood-preserving facility (and control site) |
snail (Thais haemastoma) |
|
up to |
|
figure only (n and weight basis = n.sp.) |
Elder & Dresler (1988) |
|
a |
Abbreviations used: acrid = acridinone; BA = benz[a]anthracene; BaP = benzo[a]pyrene; chrys = chrysene; d = on a dry weight basis; FA = fluoranthene; l = on a lipid weight basis; napht = naphthalene; n.d. = not detected; NSOs = heterocyclic (NSO) compounds; n.sp. = not specified; PAH = polycyclic aromatic hydrocarbon; phen = phenanthrene; w = on a wet weight basis. |
|
b |
Values in parentheses measured in samples from Passamaquoddy Bay with no apparent sources of creosote oil (according to the authors, possibly indicating widespread creosote contamination). |
|
c |
Benthic food organisms in the stomachs of the English sole from Eagle Harbor. |
The PAH burden in edible animals appears to increase not only due to living in creosote-contaminated natural habitats but also due to procedures following catch. Dunn & Fee (1979) reported on PAH contamination of lobsters (Homarus sp.), most probably attributable to creosote contamination during impoundment. Freshly caught lobsters from four different areas (total n = 19) had less than 1 µg BaP/kg wet weight in tail meat, whereas lobsters kept in a commercial tidal pound constructed of creosoted timber contained highly elevated levels of BaP and other PAHs. The maximum concentrations of BaP were 2300 µg/kg wet weight in digestive gland and 281 µg/kg wet weight in tail meat. The mean concentration of BaP in tail meat of commercial market lobsters increased from 0.6 µg/kg wet weight (n = 5) to 78.9 µg/kg wet weight (n = 10) after about 3 months (June to September 1978) of impoundment; the corresponding ranges were 0.4–0.9 µg/kg compared with 7.4–281 µg/kg. Concentrations of 13 PAHs detected in the edible tissues of a freshly caught and an impounded lobster are given in Table 19. Other PAHs that were detected but not identified or quantified were similarly elevated in impounded lobsters.
Table 19: PAH concentrations in the tail meat of lobsters (Homarus sp.) before and after impoundment.a
|
PAHs |
Concentrations |
|
|
Before |
After |
|
|
Phenanthrene |
32 |
100 |
|
Fluoranthene |
67 |
1815 |
|
Pyrene |
17.5 |
537 |
|
Triphenylene |
5.1 |
627 |
|
Chrysene |
2.2 |
303 |
|
Benz[a]anthracene |
4.4 |
222 |
|
Benzo[e]pyrene |
4.3 |
277 |
|
Benzo[b]fluoranthene |
1.1 |
261 |
|
Benzo[k]fluoranthene |
0.35 |
169 |
|
Benzo[a]pyrene |
0.76 |
281 |
|
Benzo[ghi]perylene |
0.19 |
51 |
|
Dibenz[a,h]anthracene |
n.d.b |
153 |
|
Indeno[1,2,3-cd]pyrene |
0.51 |
137 |
|
a |
Adapted from Dunn & Fee (1979). Concentrations are measured in the edible tissues of a freshly caught (before) and an impounded (after) lobster. |
|
b |
n.d. = not detected. |
Several studies have monitored the content of creosote (components) in creosoted wood products used as sleepers (Petrowitz & Becker, 1964, 1965; Rotard & Mailahn, 1987; Gurprasad et al., 1995), poles/posts (Nurmi, 1990; Bergqvist & Holmroos, 1994), or marine pilings (Drisko, 1963; Ingram et al., 1982; Gagne et al., 1995), reused as playground equipment (Rotard & Mailahn, 1987), used as firewood (Rotard & Mailahn, 1987), or used for unknown purposes (Merrill & Wade, 1985; Becker et al., 2001). The most important feature is that all of these products can contain very high concentrations of PAHs even after several decades of use; phenolic and heterocyclic compounds were also present.
Generally, there was a relative decrease in low-boiling compounds and correspondingly a relative increase in high-boiling compounds in creosote products over time due to weathering (Petrowitz & Becker, 1964, 1965; Merrill & Wade, 1985; Bergqvist & Holmroos, 1994; Gurprasad et al., 1995). The total loss of creosote has been determined for poles in service over a 10-year period (1978–1988). It was 10% aboveground, 12.1% at groundline, and 70% 0.5 m below groundline (Nurmi, 1990). Creosoted posts analysed after 40 years of service (Bergqvist & Holmroos, 1994) showed the following concentration ranges (three posts, four sections, three zones, in g/kg of moisture-free wood): acenaphthene (0.05–18), chrysene (0.17–2.9), fluoranthene (1.4–26), fluorene (0.25–14), naphthalene (<0.005–20), 2-methylnaphthalene (<0.01–8.8), phenanthrene/anthracene (0.3–41), pyrene (0.91–16), and dibenzofuran (0.14–12). BaP contents were not recorded in this investigation. In another study, BaP contents ranging from 44 to 1573 mg/kg shavings (Rotard & Mailahn, 1987) were found in wooden sleepers (n = 3) installed in German playgrounds. Comparable results were obtained from a larger-sized Canadian study on out-of-service railroad ties (sleepers), some of which had been in service for at least 60 years. BaP concentrations in the positive samples (n = 27) ranged from 86 to 656 mg/kg, with a mean of 342 mg/kg (Gurprasad et al., 1995). A complete survey on concentrations of creosote compounds detected in old railroad ties is given in Table 20. Concentrations (mg/kg wood) of some compounds in creosoted wood samples (n = 3) of unspecified origin and age were much higher than those reported in Table 20: acenaphthene (1630), fluoranthene (15 270), fluorene (3570), phenanthrene (11 990), pyrene (11 850), dibenzofuran (1870), and quinoline (1510) (Becker et al., 2001). A wood sample from a wharf treated with a creosote stain before immersion in the water about 2 years previously had a total PAH content (16 PAHs) of 141 871 mg/kg dry weight, the most abundant PAHs being phenanthrene, fluoranthene, pyrene, and fluorene (Gagne et al., 1995). Creosote extracts from different cross-sectional depths of marine pilings differed in their infrared spectra (Drisko, 1963).
Table 20: Concentrations of creosote compounds in old railway sleepers (railroad ties).
|
Compound |
Concentrations (mg/kg shavings) |
||
|
Germanya (n = 5)b |
Canadac (n = 27) |
||
|
range |
range |
mean |
|
|
Acenaphthene |
44–973 |
139–5600 |
1410 |
|
Acenaphthylene |
n.d.d–42 |
11 |
|
|
Anthracene |
273–5300 |
1170 |
|
|
Benz[a]anthracene |
167–2110 |
599 |
|
|
Benzo[a]fluoranthene |
22–419 |
||
|
Benzo[b]fluoranthene |
+ [j]: 307–2316 |
82–948 |
421 |
|
Benzo[k]fluoranthene |
100–1930 |
52–811 |
310 |
|
Benzo[ghi]perylene |
28–339 |
142 |
|
|
Benzo[e]pyrene |
30.8–1300 |
||
|
Benzo[a]pyrene |
43.8–1573 |
86–656 |
342 |
|
Cyclopenta[def]phenanthrene |
418–3917 |
||
|
Chrysene |
+ triph: 266–12 950 |
220–2260 |
681 |
|
Dibenzo[a,h]anthracene |
n.d.–187 |
64 |
|
|
Fluoranthene |
833–23 067 |
481–7820 |
2560 |
|
Fluorene |
58–1849 |
178–4910 |
1420 |
|
Indeno[1,2,3-cd]pyrene |
322–354 |
18–389 |
193 |
|
Naphthalene |
6.4–392 |
||
|
Phenanthrene |
+ anth: 1005–19 892 |
654–13 500 |
3720 |
|
Perylene |
32–231 |
||
|
Phenylnaphthalene |
101–2140 |
||
|
Pyrene |
553–11 683 |
356–5110 |
1670 |
|
Dibenzofuran |
23–990 |
||
|
Dibenzothiophene |
22–1420 |
||
|
Quinoline |
7.8–30.5 |
||
|
Phenols (phenol, mono-, di-, trimethylphenols) |
0.48–37.8 |
||
|
1-Naphthol |
0.8–5.1 |
||
|
4-Phenylphenol |
0.5–7.7 |
||
|
a |
Rotard & Mailahn (1987). |
|
b |
Three samples from sleepers installed in playgrounds, one sample from closed railway sleepers, one sample from discarded sleepers provided as firewood (with maximum concentrations in the playground sleepers); anth = anthracene; [j] = benzo[j]fluoranthene; triph = triphenylene. |
|
c |
Gurprasad et al. (1995). |
|
d |
n.d. = not detected. |
There were no reports available on concentrations of creosote-derived compounds in terrestrial flora or fauna.
No information was available on concentrations of creosote-derived compounds in aquatic plants.
Table 18 (section 5.1.4) shows concentrations of PAHs and heterocyclic compounds reported in aquatic fauna from creosote-contaminated sites. PAHs derived from creosote have been detected in several classes of aquatic fauna, including insects, molluscs (gastropods, bivalves), crustaceans, and fish collected at various creosote-contaminated sites of rivers and coastal or estuarine/ marine environments (Shimkin et al., 1951; Zitko, 1975; Dunn & Stich, 1976; Black et al., 1981; Malins et al., 1985; Pittinger et al., 1985; Rostad & Pereira, 1987; DeLeon et al., 1988; Elder & Dresler, 1988; CEPA, 1993; Pastorok et al., 1994). In general, concentrations were highest in invertebrates (see Table 18). For example, food organisms (invertebrates) of a bottom-dwelling fish (English sole, Parophrys vetulus) exposed to creosote-contaminated sediments in Eagle Harbor (USA) contained total PAH concentrations as high as 84 mg/kg dry weight. In the liver of the English soles, total PAH concentrations of about 1 mg/kg dry weight have been found (Malins et al., 1985). There were also indications of the presence of free radicals (derived from nitrogen-containing heterocycles in creosote) in liver and bile of English sole from Eagle Harbor (Malins & Roubal, 1985). Near a creosote spill site in Hersey River (USA), BaP concentrations were as high as 725 µg/kg wet weight in Trichoptera larvae, but only 0.07–1 µg/kg wet weight in several fish species (Black et al., 1981). Similarly, only trace levels of PAHs have been detected in flesh of selected fish sampled from the contaminated Elizabeth River, USA (no details given) (Huggett et al., 1987). In snails, heterocyclic compounds were found to be present at lower concentrations (up to 9.7 µg/kg wet weight) than PAHs (up to 194 µg/kg wet weight) (Rostad & Pereira, 1987; see also Table 18).
Generally, the lower PAH concentrations in fish from contaminated areas compared with invertebrates are attributed to the rapid metabolism of PAHs in fish. Consistently, relatively high concentrations of PAH metabolites have been found in creosote PAH-exposed fish (Malins et al., 1985; CEPA, 1993; Karrow et al., 1999). For example, mean concentrations of PAH metabolites (measured as BaP equivalents) in the bile of English sole (Parophrys vetulus; n = 22) exposed to creosote-contaminated sediments in Eagle Harbor (USA) amounted to 2100 ± 1500 µg/kg dry weight (compared with 100 ± 89 µg/kg dry weight in controls, n = 20) (Malins et al., 1985).
Altogether, the aquatic fauna living near creosote-contaminated sites appear to absorb PAHs significantly over background levels.
The general population can be exposed to creosote itself, to consumer products containing creosote, and to creosote constituents deposited or enriched in environmental media or food via all usual routes of exposure (inhalation of air, ingestion of food or drinking-water, skin contact).
Private users come into dermal or inhalative contact with creosote while treating garden fences, animal houses, etc. with creosote, handling/using creosoted wood constructions (e.g., fences, garden equipment, railroad ties used for landscaping, etc.), or applying creosote as a pesticide in another way. In order to limit direct exposures from these sources, some countries have restricted the sale and use of creosote or creosoted products for private purposes (RPA, 2000; ATSDR, 2002).
Consumers of fish and shellfish kept in creosoted cages or caught in contaminated waters (see section 5.1.4) can take up the accumulated creosote components or creosote metabolites via diet. In the USA (ATSDR, 2002), health officials have advised against consumption of fish from some rivers polluted with creosote (Bayou Bonfouca, Willamette River).
Residents near creosote facilities, creosote waste sites, or sites where creosote-treated scrap lumber is incinerated may be exposed by inhalation (contaminated air), by ingestion of food (fruits and vegetables with contaminated surfaces), and/or by drinking (contaminated groundwater) (BKH, 1995).
Children playing on creosoted playground equipment can be exposed to creosote (components) present on the wood surface (exudation), in the surrounding soil (leaching), or in the air (evaporation). Small children touching the treated wood and playing with sand may have not only intensive skin contact, but also some oral intake from hand-to-mouth transfer (BKH, 1995).
A study on the assessment of multi-pathway exposure of small children to PAHs by measuring urinary concentrations of 1-pyrenol found that food seems to be a main source of total pyrene and total PAH uptake in small children, even with relatively high concentrations of PAHs in urban air (Vyskocil et al., 2000). Studies of occupational exposure to creosote (see section 5.3) have shown that dermal exposure is the most important route of exposure.
There are only scarce data on creosote-related contamination of drinking-water (see section 5.1.2.1).
Drinking-water is not monitored for creosote itself, but some components of the mixture (e.g., "priority PAHs" listed in Table 4) are sometimes monitored.
Due to the complexity of creosote and the many different exposure situations, exposure profiles may vary widely. Detailed measurements are lacking. Some estimations using BaP as a marker substance have been published for important exposure scenarios: children playing on creosoted playground equipment (see Table 21) (BKH, 1995; BMU, 1995; EC, 1999) and residents living in the neighbourhood of creosoting plants (Table 22) (BKH, 1995).
Table 21: Survey on published estimations of exposure of children in playgrounds to BaP in creosote.
|
Group (country) |
Route |
BaP content in creosote |
Exposure period |
Starting assumptions |
Estimated BaP |
Referencea |
|
Children playing on creosoted playing equipment (Germany) |
Dermal |
25 mg/kg |
Once per week |
Estimated skin burden per week: 10 µl creosote |
2.6 ng/kgb body weight per day |
BMU (1995); EC (1999) |
|
Children playing on creosoted playing equipment (country not known to authors) |
Dermal |
Information was not available to the authors |
2 h or 4 h/day |
50% coverage of open skin, body weight of 15 kg |
0.85 or 1.7 ng/kgb body weight per day |
WS Atkins International Ltd (1997) |
|
Children playing on creosoted playing equipment (Netherlands) |
Dermal |
50 mg/kg |
Daily (3 h) |
Extrapolation of data from creosote-exposed workers (measurements of pyrene concentrations on workers’ skin; conversion to BaP concentrations) to children’s exposure |
20.4c/2.04d ng/kgb body weight per day |
BKH (1995) |
|
a |
A discussion of these studies is given in CSTEE (1999). |
|
b |
Assuming body weight of child is 15 kg. |
|
c |
Figure given in reference. |
|
d |
Figure obtained by recalculation (probable mistake: 110.5 µg pyrene (measured) corresponds to 0.163 µg (not 1.63 µg) BaP (calculated). |
Although three different calculations were used for children’s exposure, the results were in a comparable order of magnitude: namely, about 1–2.6 ng BaP/kg body weight per day (see Table 21). Exposure of people consuming garden crops contaminated by airborne creosote has been estimated to be in the range of 1–70 µg BaP/kg body weight per day (see Table 22). Generally, the estimations performed are highly uncertain due to the many assumptions that had to be made because of the lack of representative measured data. Exposure estimations for other components or substance classes (e.g., phenols or cresols) to which people near creosote sources may be exposed at increased levels are not available.
Table 22: Estimates of exposure to BaP from creosote for people living in the neighbourhood of creosote plants.a
|
Route |
BaP content in creosote (assumed) |
Starting assumptions |
Estimated BaP |
|
Inhalation |
500 mg/kg |
Storage yard of creosoted wood: BaP concentrations calculated at a distance of 100 and 250 m, based on emission measurements and using a distribution model (no details given) |
0.5–5 ng/m3 |
|
Oral (consumption of vegetables and fruits from gardens) |
500 mg/kg |
BaP concentration on crops at air concentrations of 0.5–5 ng/m3: 0.2–10 mg/kg crop |
1.4–71.4b (11c) µg/kg body weight per day |
|
a |
From BKH (1995). |
|
b |
Figure obtained by recalculation (5000 µg ÷ 70 = 71 µg, not 11 µg). |
|
c |
Figure given in reference. |
A human monitoring study has been performed on subjects living in the vicinity of a creosote impregnation plant in Delson, Quebec, Canada. Urinary metabolites of naphthalene (1- and 2-naphthol) and pyrene (1-pyrenol) were used as biomarkers of exposure. Morning and evening urine samples (Sunday evening and Monday morning in mid-August 1999) were collected from 30 exposed individuals (male and female adults, non-smoking) living at a distance of 50–360 m downwind of the plant and from a control group (n = 30) in the adjoining municipality residing at a distance of 1.9–2.7 km upwind of the plant. Excretion values of 1- and 2-naphthol were found to be significantly higher in the exposed group than in the controls (P < 0.04), after accounting for possible confounding variables. The respective geometric mean concentrations (or 5th/95th percentiles; arithmetic means) of 1-naphthol for the exposed and non-exposed groups were 2.04 (0.55/6.00; 2.59) and 1.36 (0.39/7.02; 1.94) µmol/mol creatinine for evening samples and 2.49 (0.77/8.43; 3.03) and 1.17 (0.37/6.88; 1.64) µmol/mol creatinine for morning samples. Corresponding values for 2-naphthol were 1.78 (0.82/3.67; 1.71) and 1.36 (0.63/5.07; 1.71) µmol/mol creatinine for evening samples and 1.94 (1.03/4.96; 2.13) and 1.08 (0.49/5.05; 1.36) µmol/mol creatinine for morning samples. However, the 1-pyrenol excretions in the exposed and control groups were not significantly different (P > 0.5). The uptake of pyrene due to the plant was too small to contribute significantly to the 1-pyrenol excretion, whereas the uptake of naphthalene, being more volatile and in higher concentrations in the air, could be monitored via 1- and 2-naphthols (Bouchard et al., 2001).
Exposure to creosote is possible in several occupations involved in the manufacture, use, transport, or disposal of creosote or creosoted wood products — for example, employees of coal tar distillation and wood impregnation plants, carpenters, assemblers of railroad switches, workers involved in handling, installing, or repairing impregnated timber constructions, gardeners or farmers painting fences, etc., with creosote or applying it as a pesticide, or workers handling discarded impregnated wood or contaminated soil. Most data are available for workers of wood impregnation plants. Studies of occupational exposure to creosote have shown that dermal exposure is the most important exposure route.
CTPV air concentrations from wood impregnation plants have been compiled in Table 23 (Markel et al., 1977; NIOSH, 1980, 1981b; Flickinger & Lawrence, 1982; Todd & Timbie, 1983; US EPA, 1984c; Alscher & Lohnert, 1985; Heikkilä, 2001; Borak et al., 2002). The creosote aerosol concentrations ranged from <0.4 µg/m3 (NIOSH, 1981b) to 9710 µg/m3 (Todd & Timbie, 1983). As seen in Table 23, maximum values frequently exceeded the permissible occupational exposure limit of 0.2 mg/m3, which has been set, for example, in the USA (ACGIH, 2000). Some studies have shown that the CTPV method is not a precise (Todd & Timbie, 1983) or sensitive method (Borak et al., 2002) for creosote fumes.
Table 23: Survey on concentrations of CTPV or similar PAH surrogates measured in wood impregnation plants.a
|
Country, year |
Concentration |
Measure |
Remarks |
Reference |
|
Finland, 1980 |
20–400 |
CTPV; n = 8; s = n.sp. |
Heikkilä (2001) |
|
|
The Netherlands, year n.sp. |
<22–>200 |
particulate matter (benzene soluble); n = 34; p |
full-shift |
Borak et al. (2002) |
|
USA (Arkansas), 1976 |
70–550 |
PPOM; n = 11; p + a |
Markel et al. (1977) |
|
|
USA (Texas), 1980 |
3–1211 |
CTPV; n = 18 (8 job categories); p |
NIOSH (1980) |
|
|
USA (Washington), 1980 |
|
CTPV |
NIOSH (1981b) |
|
|
USA, n.sp. |
56 |
CTPV (benzene soluble); geometric mean |
five plants (n = 155) (8-h TWA) |
Flickinger & Lawrence (1982) |
|
USA, n.sp. |
90–9710 |
CTPV; a (n = 5) |
Todd & Timbie (1983) |
|
|
USA, n.sp. |
20–9000 |
creosote particles; s, n = n.sp. |
estimate (based on data from AWPI) |
US EPA (1984c) |
|
USA, 1982 |
100 |
particulate matter (benzene soluble); s, n = n.sp. |
Alscher & Lohnert (1985) |
|
|
North America, n.sp. |
50 (in one sample only) |
CTPV |
four plants, gloves and whole-body dosimeters |
Bookbinder & Butala (2001) |
|
a |
Abbreviations used: a = area sampling; AWPI = American Wood-Preservers’ Institute; CTPV = coal tar pitch volatiles; n.sp. = not specified; p = personal sampling; PAH = polycyclic aromatic hydrocarbon; PPOM = particulate polycyclic organic matter; s = sampling; TWA = time-weighted average. |
A maximum CTPV concentration of 59 µg/m3 has been measured in personal air samples of dock builders (n = 3; New York, USA, 1980). However, sampling occurred on an atypically cool day when workers were mostly not operating. Therefore, the authors assumed that exposure may be substantially higher on more representative days. Additionally, visual inspection indicated a high potential for direct skin contact with creosote (NIOSH, 1981a).
Creosote vapours have been monitored at different workplaces in Finland by Heikkilä et al. (1987). The total TWA concentrations ranged from 0.5 to 9.1 mg/m3 in two creosote impregnation plants (total n = 22), with high peak concentrations (37–71 mg/m3) during opening and cleaning of the creosote warming chamber. Expoure to these peak concentrations was lower in one plant due to automation and in general due to local exhaust suction. In other plants/working sites where creosoted wood had to be handled (total n = 28), total TWA concentrations of 0.1–11 mg/m3 have been found — i.e., railway switch assembly hall (4.7–11 mg/m3), repairing of railway (0.1–1 mg/m3), replacement of rails in railway yard (0.7–7 mg/m3), welding of switches (0.5–0.7 mg/m3), or stevedores at ports (1.0 mg/m3). Compounds measured in the vapours (and used for sum calculations) included toluene, xylenes, trimethyl benzenes, methyl ethyl benzenes, benzofuran, methyl indene, xylenols, dibenzofuran, fluorene, acenaphthylene (each less than 5%), phenol, methyl styrenes, indene, cresols, benzothiophene, acenaphthene (each 5–15%), and naphthalene and its alkyl homologues (each more than 15%).
Total concentrations of vapour-phase PAHs have not been given. However, the main vapour-phase PAH naphthalene was present on average at 32% (handling of treated wood) or 52% (wood impregnation) of the total vapour concentration. The mean total particle-bound PAH concentrations (3–6 aromatic rings) ranged from 0.2 to 106 µg/m3 in the impregnation plants and from 0.8 to 46 µg/m3 in the handling of impregnated wood. Usually, the proportion of particulate PAHs relative to the total PAH concentration of vapours was below 0.5%, except during welding processes, for which it was about 4% (Heikkilä et al., 1987).
Personal air sampling was performed for CTPV and 11 PAH components of creosote in four wood impregnation plants in North America (Bookbinder & Butala, 2001). Air sampling showed concentrations of 2.2 mg/m3 for naphthalene and 0.6 mg/m3 for methylnaphthalene, but otherwise there were few or no creosote components, including BaP. CTPV was quantifiable in only one sample (0.05 mg/m3).
A survey on concentrations of individual creosote components present in workplace air in five plants (two in Finland, one each in Germany, Sweden, and the Netherlands) is presented in Tables 24 (wood impregnation) and 25 (operations with impregnated wood). It included selected PAHs (non-heterocyclic and heterocyclic), phenolic compounds, and other constituents (biphenyl, methyl styrenes) in the vapour and/or particulate phase. Generally, the distribution equilibrium of airborne contaminants in the vapour and particulate phases depends on boiling point and adsorptive affinity of the compound and on surrounding conditions (e.g., temperature).
Table 24: Workplace air concentrations of creosote-related compounds in wood impregnation plants.
|
Compound |
Concentrations in aira,b (µg/m3) |
||||||
|
(1) |
(2) |
(3) |
(4) |
(5) |
(6) |
(7) |
|
|
means |
mean |
s.m. |
range |
||||
|
Acenaphthene |
200–3000 v |
||||||
|
Acenaphthylene |
<100–200 v |
||||||
|
Anthracene |
1–19 p |
18 v+p |
|||||
|
Benz[a]anthracene |
0.4 p |
||||||
|
Benzo[a]fluorene |
0.2–0.54 p |
0.094 p |
0.6 p |
||||
|
Benzo[b]fluoranthene |
0.07 p |
||||||
|
Benzo[k]fluoranthene |
0.01–0.06 p |
0.014 p |
0.19 p |
||||
|
Benzo[ghi]perylene |
<0.01–0.02 p |
0.012 p |
|||||
|
Benzo[a]pyrene |
0.01–0.06 p |
0.014 p |
<0.01–0.07 p |
0.07–0.8 p |
0.05 p |
||
|
Benzo[e]pyrene |
0.03–0.16 p |
0.047 p |
|||||
|
Chrysene |
0.11–0.69 p |
0.17 p |
0.8 p |
||||
|
Dibenzo[a,h]anthracene |
<0.01–0.02 p |
0.011 p |
|||||
|
Fluoranthene |
14 v+p |
||||||
|
Fluorene |
<100–2200 v |
0.30 p |
18 v+p |
||||
|
Indene |
400–4200 v |
||||||
|
Indeno[1,2,3-cd]pyrene |
|||||||
|
Naphthalene |
2200–41 000 v |
1540 v |
650 v+p |
2200 v |
|||
|
Methylnaphthalene |
300–7000 v |
600 v |
|||||
|
Phenanthrene |
10–61 p |
4.02 p |
179 v+p |
||||
|
Pyrene |
1.1–6.1 p |
0.97 p |
0.3–3.0 v+p |
||||
|
Biphenyl |
<100–900 v |
||||||
|
Isoquinoline |
<100–400 v |
||||||
|
Quinoline |
<100 v |
||||||
|
Benzothiophene |
100–2800 v |
||||||
|
Dibenzothiophene |
<100–500 v |
||||||
|
Dibenzofuran |
<100–700 v |
||||||
|
Cresols |
<100–600 v |
||||||
|
Methyl styrenes |
200–2000 v |
||||||
|
Phenol |
100–1800 v |
||||||
|
Xylenols |
100–900 v |
||||||
|
a |
(1) Finland, creosote (using Polish creosote) plant 1 (railway ties) and plant 2 (poles), 1985, range of means for three different working areas (workers, 18 samples; openings of the impregnation chamber, 2 samples; cleaning of the chamber, 3 samples) (Heikkilä et al., 1987). |
|
(2) Finland, creosote (using Polish creosote) plant 1, 1987, personal air samples from six workers, TWA concentrations over a workweek (total n = 60) (Elovaara et al., 1995; Heikkilä et al., 1997). |
|
|
(3) Finland, 1980, no details (Heikkilä, 2001). |
|
|
(4) Germany, 1984, creosote plant; no details (Alscher & Lohnert, 1985). |
|
|
(5) Sweden, plant (railway ties), 1983, one typical personal sample from handling creosote-impregnated railroad ties (Andersson et al., 1983). |
|
|
(6) The Netherlands, plant (railway ties), 1991, personal air samples from 10 workers over 2 days (Van Rooij et al., 1993a). |
|
|
(7) USA, four creosote plants, personal air samples from 26 workers (Bookbinder & Butala, 2001). |
|
|
b |
Abbreviations used: s.m. = single measurement; p = particulate phase; v = vapour phase. |
Table 25: Workplace air concentrations of creosote-related compounds during operations with creosoted wood.
|
Compound |
Concentrations in aira,b (µg/m3) |
|||||
|
(1) |
(2) |
(3) |
(4) |
(5) |
(6) |
|
|
n.sp. |
n.sp. |
mean |
mean |
mean |
mean |
|
|
Acenaphthene |
200 v |
100 v |
||||
|
Acenaphthylene |
<100 v |
100 v |
||||
|
Anthracene |
<0.01–0.3 p |
<0.01 p |
0.5 p |
1.8 p |
||
|
Benz[a]anthracene |
<0.01–2.9 p |
<0.01–1.0 p |
||||
|
Benzo[a]fluorene |
<0.01–0.8 p |
<0.01 p |
0.06 p |
1.6 p |
||
|
Benzo[b]fluoranthene |
<0.01–1.0 p |
<0.01 p |
||||
|
Benzo[k]fluoranthene |
<0.01–0.7 p |
<0.01 p |
0.02 p |
0.64 p |
||
|
Benzo[ghi]perylene |
<0.03–0.2 p |
<0.01 p |
<0.01 p |
0.16 p |
||
|
Benzo[a]pyrene |
<0.01–1.0 p |
<0.01–0.6 p |
0.04 p |
0.64 p |
~0.01 p |
<0.01 p |
|
Benzo[e]pyrene |
<0.01–0.6 p |
<0.01–0.2 p |
0.07 p |
2.1 p |
||
|
Chrysene |
0.01–3.5 pc |
<0.01–0.3 pc |
0.05 p |
2.9 p |
||
|
Dibenzo[a,h]anthracene |
<0.03–0.3 p |
<0.01 p |
<0.01 p |
0.15 p |
||
|
Fluoranthene |
0.15–8.9 p |
<0.01–2.8 p |
||||
|
Fluorene |
100 v |
<100 v |
||||
|
Indene |
200 v |
<100 v |
||||
|
Indeno[1,2,3-cd]pyrene |
||||||
|
Methylnaphthalene |
800 v |
200 v |
||||
|
Naphthalene |
1000–8500 v |
2600 v |
200 v |
1100 v |
400 v |
|
|
Phenanthrene |
0.08–7.6 p |
<0.01–2.8 p |
6.5 p |
21 p |
||
|
Pyrene |
0.11–7.7 p |
<0.01–1.9 p |
0.6 p |
13 p |
0.6 p |
0.07 p |
|
Biphenyl |
100 v |
100 v |
||||
|
Isoquinoline |
<100 v |
<100 v |
||||
|
Quinoline |
200 v |
<100 v |
||||
|
Benzothiophene |
100 v |
<100 v |
||||
|
Dibenzothiophene |
<100 v |
<100 v |
||||
|
Dibenzofuran |
<100 v |
<100 v |
||||
|
Cresols |
<700 v |
<100 v |
||||
|
Methyl styrenes |
2700 v |
<100 v |
||||
|
Phenol |
<100 v |
<1100 v |
||||
|
Xylenols |
200 v |
<100 v |
||||
|
a |
(1) Assembling of rails, Finland, 1983 (Mäkinen & Korhonen, 1983). |
|
(2) Rail welding, Finland, 1983 (Mäkinen & Korhonen, 1983). |
|
|
(3) Assembly hall, Finland, 1985, personal air samples from two workers (total n = 8) (Heikkilä et al., 1987). |
|
|
(4) Rail welding, Finland, 1985, personal air samples from two workers (total n = 4) (Heikkilä et al., 1987; Heikkilä, 2001). |
|
|
(5) Construction and repairing of rails, Finland, 1985, personal air samples from five workers (total n = 8) (Heikkilä, 2001). |
|
|
(6) Loading on ship, Finland, 1985, personal air samples from two workers (total n = 9) (Heikkilä, 2001). |
|
|
b |
Abbreviations used: n.sp. = not specified; p = particulate phase; v = vapour phase. |
|
c |
Including triphenylene. |
Most compounds detected are non-heterocyclic PAHs, with naphthalene, methylnaphthalenes, indene, acenaphthene, and fluorene being predominant in the vapour phase; the main PAHs of the particulate phase included fluorene, phenanthrene, anthracene, and pyrene. Usually, naphthalene and BaP (the latter being mainly particle-bound) are used as marker substances. Concentrations as high as 41 mg/m3 (wood impregnation; Table 24) or 8.5 mg/m3 (handling of impregnated wood; Table 25) have been reported for naphthalene. Maximum BaP concentrations have been reported as 0.8 µg/m3 (Table 24) and 1.0 µg/m3 (Table 25).
The most abundant heterocyclic PAH has been benzothiophene, showing maximum mean concentrations of 100 µg/m3 (Table 25) or 2800 µg/m3 (Table 24).
Phenol concentrations ranged from <100 to 1800 µg/m3 (Tables 24 and 25). Concentrations reported for biphenyl amounted to <100–900 µg/m3, and those for methyl styrenes, <100–2700 µg/m3 (Tables 24 and 25).
There are also some data from workplaces involved in creosote production. For example, total PAH concentrations (gaseous and particulate PAHs) in a coal tar distillation plant in the Netherlands ranged from 4.7 to 26 µg/m3, and pyrene (the only individual PAH for which a value was given) concentrations ranged from 1.4 to 8.5 µg/m3, relating to geometric means (total n = 23) of TWA exposures over 8 h (Jongeneelen et al., 1986).
A Finnish study addressed exposure of workers (about 20) involved in cleanup operations of highly creosote-contaminated soil in an old gasworks area (>2000 mg PAHs/kg soil). Air monitoring (personal and stationary sampling) showed exposure levels of 0.038–0.884 mg/m3 for volatile PAHs, 0.004–0.183 mg/m3 for particulate PAHs, 0.035–0.831 mg/m3 for naphthalene, and <0.0002 mg/m3 for BaP. For urinary levels of 1-pyrenol in these workers, see section 5.3.2 (Priha et al., 2001).
Direct contact of creosote with skin is most likely for workers (including farmers and carpenters) applying creosote manually or in open systems or handling creosoted wood. In the latter case, the potential for exposure does not come solely from freshly treated wood; rather, it continues for many years, because bleeding out of creosote from creosoted wood is common. Skin can also be exposed to creosote vapours and aerosols present in air or deposited on surfaces of tools, other equipment, or clothing.
To date, no standard methods exist for assessing dermal exposure (Benford et al., 1999). A study of dermal exposure among workers of a Dutch plant for impregnation of railroad sleepers using the dermal exposure pad method (six pads on different sites of the body of 10 workers) resulted in an estimated mean total pyrene skin contamination of 500 µg/day (range 47–1510 µg/day) (Van Rooij et al., 1993a). According to Van Rooij et al. (1994), the exposure pad monitoring devices resulted in a 2-fold underestimation compared with skin wipes. The true mean total skin dose was therefore about 1 mg/day.
The pyrene dose on the skin was reduced by 35% and 1-pyrenol excretion in urine was reduced by 50% with the use of protective clothing (coverall, gloves, and socks of treated cotton material), confirming that the skin is an important route of uptake and that protective clothing reduces workers’ exposure effectively (Van Rooij et al., 1993a).
In a study to determine the exposure of workers applying creosote to wood by pressure treatment, dermal exposure was assessed by passive dosimetry with cotton gloves and cotton whole-body dosimeters under work clothing (Bookbinder & Butala, 2001). Gloves and whole-body dosimeters were removed at the end of the work cycle and analysed by GC-MS for nine PAHs (creosote constituents; no further details). Dermal exposures were highest in workers not wearing protective gloves. The highest dermal exposure occurred in workers with direct contact with creosote. The majority of dermal exposure (µg creosote/kg body weight per day) was of hands (104.6), compared with 25.1 for arms, 21.8 for torso top, 14.8 for torso bottom, and 28.8 for legs.
In a further study to characterize the relationship between inhalation and dermal exposures in creosote-exposed wood treatment workers, full-shift breathing-zone air samples were collected and analysed for benzene-soluble fraction and 16 individual PAHs in both the particulate and gaseous fractions (Borak et al., 2002). Urinary 1-pyrenol levels were measured in post-shift urine samples and next-day urine samples. Although airborne concentrations appeared to be low, urinary 1-pyrenol measurement gave strong evidence that some of these workers had been exposed to creosote and that systemic absorption had occurred, and this must have been by the dermal route (Borak et al., 2002).
Urinary 1-pyrenol is a widely adopted biological marker of occupational exposure to PAHs (Jongeneelen et al., 1988b; Bouchard & Viau, 1999; Jongeneelen, 2001). Urinary 1-pyrenol can be formed only from exposure to pyrene, a non-carcinogenic PAH at the more volatile end of the PAH spectrum. The abundance of pyrene is relatively high and shows a good correlation with exposure as measured by the 11 PAHs chosen for monitoring by the United Kingdom Health and Safety Executive or the 16 PAHs chosen for monitoring by the US EPA. BaP has a much lower abundance than pyrene. However, in the case of creosote, the airborne PAH results show that the profile of PAHs for timber impregnation is dominated by naphthalene and the more volatile PAHs. It is therefore suggested that creosote might be better monitored by measurement of urinary 1-naphthol (Heikkilä et al., 1995). Whereas naphthalene is mainly inhaled, the four- to six-ring PAHs have a 100–200 times lower concentration in air and are mainly taken up through the skin. Therefore, urinary 1-naphthol alone is not suitable as a marker substance either for assessment of inhalation or cutaneous exposure to total PAHs or for assessment of exposure to the five- or six-ring carcinogenic PAHs (Heikkilä et al., 1997).
Two PAH metabolites in the urine of workers have been monitored as internal markers of PAH/creosote exposure. The data obtained for 1-naphthol (Heikkilä et al., 1995, 1997) and 1-pyrenol (Jongeneelen et al., 1985, 1986; Jongeneelen, 1992; Van Rooij et al., 1993a; Viau et al., 1993; Elovaara et al., 1995; Heikkilä et al., 1995; Borak et al., 2002) — their parent compounds belonging to the major constituents of creosote (see section 2) — have been compiled in Table 26. The studies have been performed with workers of different creosote-related workplaces (impregnation of wood, handling of treated wood, or creosote production) in Canada, Finland, and the Netherlands. There was a clear distinction between exposed workers and concurrent controls or other background values.
Table 26: Concentrations of hydroxy metabolites of pyrene and naphthalene in the urine of workers.
|
Workplace |
Details |
Concentration in urine (in µmol/mol creatinine, unless otherwise specified) |
Reference |
|
|
1-Pyrenol |
1-Naphthol |
|||
|
Wood impregnation |
||||
|
Canada, 1991 |
middle of the workweek |
|
Viau et al. (1993) |
|
|
Finland, 1987 |
end of shift (3 days) |
|
|
Elovaara et al. (1995); Heikkilä et al. (1997) |
|
The Netherlands, 1991 |
Monday to Tuesday |
|
Van Rooij et al. (1993a) |
|
|
The Netherlands |
|
|
Jongeneelen et al. (1985, 1988b); Jongeneelen (1992) |
|
|
The Netherlands workers (n = 36) of low (n = 20), moderate (n = 13), high (n = 3) exposure |
post-shift + next-day samples (n = 68), range |
<0.1–63 µg/g creatinine |
Borak et al. (2002) |
|
|
Handling of treated wood |
||||
|
Finland, 1987 railway switch assembly, workers |
mean (range) |
|
|
Heikkilä et al. (1995) |
|
The Netherlands |
n.sp., range |
0.2–4.5 |
Jongeneelen (1992) |
|
|
Creosote production |
||||
|
The Netherlands distillation of coal tar, |
during workweek |
|
Jongeneelen et al. (1986) |
|
|
a |
Smokers and non-smokers |
|
b |
Corresponding to 1350 µmol/mol creatinine (220–2950 µmol/mol creatinine). |
|
c |
A reference value for non-occupationally exposed people in Finland was 0.23 µmol/mol creatinine (Finnish Institute of Occupational Health, 1999). |
|
d |
n.sp. = not specified. |
|
e |
Corrected for background excretion (44 randomly selected samples). |
The arithmetic mean urinary concentration of 1-naphthol in Finnish wood impregnation plant workers (Heikkilä et al., 1997) was comparable to that found in assemblers setting up (in a hall) switch elements into railway ties impregnated with a Polish creosote (Heikkilä et al., 1995) (1350 vs. 1370 µmol/mol creatinine; see Table 26). The correlation between TWA concentrations of naphthalene and the end-of-shift urinary 1-naphthol concentrations was fairly good (r = 0.75) for wood impregnation plant workers (Heikkilä et al., 1997), but poor (r < 0.5) for assemblers (Heikkilä et al., 1995).
The mean urinary concentration of 1-pyrenol was about 10 times higher in the wood impregnation workers (64 µmol/mol creatinine) (Elovaara et al., 1995) than in the assemblers (Heikkilä et al., 1995). 1-Pyrenol concentrations reported from other wood impregnation plants ranged from 0.2 µmol/mol creatinine (Viau et al., 1993) to 82 µmol/mol creatinine (Jongeneelen, 1992) (see also Table 26).
Geometric means (medians) of up to 12 µmol 1-pyrenol/mol creatinine have been measured in workers of a coal tar distillation plant producing (among other chemicals) creosote (Jongeneelen et al., 1986) (see also Table 26).
Monitoring of urinary 1-pyrenol in workers involved in cleanup operations of highly creosote-contaminated soil (see section 5.3.1.1) suggested that some exposure occurred, for example, in excavators and tractor drivers (n = 10), showing concentration ranges (corrected for creatinine content) of <0.5–23.7 nmol/litre (before work period) and 3.3–233 nmol/litre (during work period). The increased values were thought to be caused mainly by poor skin protection (Priha et al., 2001).
The correlation between breathing-zone air concentrations of pyrene and urinary 1-pyrenol concentrations was found to be low (r < 0.5) in both wood impregnators (Van Rooij et al., 1993a; Elovaara et al., 1995) and assemblers (Heikkilä et al., 1995). Similarly, this correlation was small in a group of creosote workers at a facility where railroad ties were heated and pressure-treated with creosotes. Almost the entire internal dose could be attributed to dermal rather than inhalation exposure (Borak et al., 2002).
Smoking increases the excretion of urinary 1-pyrenol, but the confounding influence of smoking on 1-pyrenol excretion in creosote-exposed workers is hardly detectable, due to the relatively high occupational dose of pyrene in creosote-exposed workers (Jongeneelen et al., 1986; Viau et al., 1993; Borak et al., 2002).
Van Rooij et al. (1993a) compared the content of 1-pyrenol in urine of workers of a Dutch wood impregnation plant, with and without protective clothing. On the day the workers did not wear a coverall, the excreted amount of 1-pyrenol in urine, sampled from Monday morning (08:00) to Tuesday morning (06:00), was higher than on the day the workers wore a coverall (see Table 26). Differences in urinary 1-pyrenol excretion correlated well with differences in pyrene skin contamination, but poorly with differences in pyrene breathing air concentrations.
Altogether, in the studies mentioned above, concentrations of the urinary metabolites were better indicators of total exposure than concentrations of the PAHs in air analyses, because they reflect all routes of exposure, including dermal.
BaP metabolites have not been monitored in the urine of creosote workers, probably due to difficulties in analysis of small quantities (Ariese et al., 1994; Grimmer et al., 1997).
Generally, it should be noted that PAH metabolites are not specific for creosote per se. However, despite the frequent general occurrence of their parent compounds (IPCS, 1998), 1-pyrenol and 1-naphthol appear to be useful indicators of occupational exposure to (creosote) PAHs, if possible confounding factors are considered (e.g., Van Rooij et al., 1994; Quinlan et al., 1995; Yang et al., 1999; Viau, 2002). Nevertheless, because of the complexity of creosote, it is not clear if they are also suitable indicators of health risk.
PAH–DNA adducts in white blood cells of a group of workers exposed to creosote oil (no details given) have been monitored at the start (Monday) and at the end (Friday) of the working period. Results showed an increase in the overall adduct levels during the working period and a remarkable interindividual difference with regard to the types of adducts formed (Roggeband et al., 1991; see section 6).
Using the previous air and urine monitoring data (Elovaara et al., 1995; Heikkilä et al., 1995, 1997) of creosote workers (impregnators and assemblers), Heikkilä (2001) estimated the daily inhaled uptake of naphthalene and pyrene and compared it with the predicted and the real daily output of urinary 1-naphthol and 1-pyrenol. The results suggested that 50–70% of internal naphthalene exposure and over 99% of internal pyrene exposure were attributable to percutaneous uptake. The total daily uptake of naphthalene amounted to 15/16 mg/worker (assembler/impregnator), and that of pyrene to 0.6/5 mg/worker (assembler/impregnator). The skin contamination was estimated to be 50 mg naphthalene/worker per day and 27 mg pyrene/worker per day for impregnation plant workers and 60 mg naphthalene/worker per day and 3.3 mg pyrene/worker per day for assemblers. These calculations were based on a series of assumptions (for inhalation uptake: lung ventilation of workers was 25 litres/min; inhalative uptake of naphthalene and pyrene was 50%; for excretion: 7% of the naphthalene and 4% of the pyrene taken up via the lungs and the skin were excreted in urine as 1-naphthol and 1-pyrenol, respectively; for percutaneous absorption: 18% of the dose applied to skin was absorbed).
Another study in creosote workers (Van Rooij et al., 1993a) also found the skin to be the main route of pyrene uptake. The authors concluded from their calculations (based on the assumptions of Van Rooij et al., 1993b) that 69 µg (median; range: 9.4–302 µg) of pyrene entered the body through the skin, and 4.5 µg (median; range: 1.5–15 µg) entered via respiration during an 8-h workshift; thus, dermal uptake contributed more than 90% to total dose. A similar high contribution (>90%) of dermal exposure to internal dose for pyrene was confirmed by a recent study with creosote workers (Borak et al., 2002).
Therefore, surface and skin wipe samples will be a more suitable tool than air measurements to monitor exposure to creosote in the working environment (e.g., Klingner & McCorkle, 1994).
Intake estimations for the general population are available for pyrene (Van Rooij et al., 1994; IPCS, 1998). The values are much lower than those shown for creosote workers. For example, daily intakes of 2 µg/day for non-smokers and 4 µg/day for smokers among the general population in the Netherlands have been reported (Van Rooij et al., 1994).
There are no animal or human studies available investigating the specific extent or rate of coal tar creosote absorption following oral, inhalation, or dermal exposure. However, there are several indications that a significant absorption of coal tar creosote components occurs.
Metabolites of PAHs have been found in urine of workers impregnating wood with creosote or handling creosoted wood; exposure was therefore mainly via inhalation and skin contact (Jongeneelen et al., 1985, 1988b,c; Bos & Jongeneelen, 1988; Van Rooij et al., 1993a; Elovaara et al., 1995; Heikkilä et al., 1995, 1997; see also section 6.4). Volunteers (n = 2, male) exposed to a single topical dose of 100 µl creosote (no specification given) applied to the inner face of the forearms also excreted 1-pyrenol, a hydroxy PAH metabolite (Viau & Vyskocil, 1995; see also section 6.4).
Based on the results of urinary excretion of metabolites (in relation to estimated inhalative uptake of the parent compounds), which were obtained with creosote workers (see also sections 5.3 and 6.4), it has been suggested that 50–70% of naphthalene and more than 90% of pyrene uptake could be attributed to skin absorption.
Indirect evidence for absorption of creosote components by oral, dermal, or respiratory routes is also given through the toxic effects elicited in animals (section 7) and humans (section 8) following creosote exposure.
Generally, PAHs are well absorbed from the digestive tract, lungs, or skin of laboratory animals or humans, as compiled in several reviews (e.g., IPCS, 1998; ATSDR, 2002).
For example, when [14C]naphthalene was given orally to rats, about 84% of the 14C dose was recovered in urine and about 7% in faeces within 72 h (Bakke et al., 1985). A pilot study with two human volunteers confirmed that naphthalene is absorbed into the body after oral, respiratory, and dermal exposure (Heikkilä, 2001). The oral availability of soil-bound BaP administered by gavage to rats changed with the type of soil (sand > clay) (Goon et al., 1991). Hack & Selenka (1996) investigated the mobilization of PAHs from contaminated soil and found that under gastrointestinal conditions, with the addition of lyophilized milk, mobilization ranged from 7% up to 95%. Ingestion bioavailabilty of pyrene is estimated at 12.5% (CanTox, 1991).
Absorption of PAHs from lungs occurs more rapidly for free PAHs than for particle-bound PAHs (IPCS, 1998). Administration of labelled BaP (in acetone) to the skin of rhesus monkeys resulted in 51% absorption after 7 days. When a BaP in soil mixture was applied, dermal absorption decreased to 13.2% (Wester et al., 1990). Cross-species in vitro dermal absorption tests with labelled BaP showed a skin absorption of about 95% for rats, 51% for hairless guinea-pigs, and 23–43% for humans by 48 h post-exposure (Moody et al., 1995). The dermal half-life or penetration rate of BaP varied greatly with the presence and type of co-substances applied (Dankovic et al., 1989; Roy et al., 1996; Sartorelli et al., 1999); therefore, extrapolation from studies with single components or other mixtures or matrices is of limited predictive value.
Phenolic compounds are also readily absorbed through respiratory and gastrointestinal tracts and through the skin (Fellows, 1937, 1939; IPCS, 1994, 1995). Heterocyclic compounds may also be absorbed by all routes of exposure.
For estimations of uptake using the biomarkers 1-pyrenol and 1-naphthol, see section 6.4.
Distribution studies with coal tar creosote have not been performed. Studies on the individual constituents are, however, likely to reflect their distribution, even when administered in creosote.
For example, studies on PAHs, mostly BaP, have shown that after administration of labelled compound, detectable levels of radioactivity occurred in almost all internal organs, particularly fat-rich tissues (including breast milk and placenta) (IPCS, 1998; ATSDR, 2002). Disposition in brain tissues has been shown for BaP (Saunders et al., 2002). Phenolic compounds are found to be rapidly distributed all over the body (IPCS, 1994, 1995). Therefore, it is expected that administration of creosote would result in a wide distribution of its components in the body.
Studies on the metabolism of coal tar creosote are limited in number and refer principally to PAH components.
Generally, PAHs and other xenobiotics are metabolized by microsomal oxidative enzyme systems, in particular the cytochrome P450 (CYP) system (CYP1A1, CYP2E1, and CYP3A), in liver, lungs, and other tissues. PAHs undergo hydroxylation, thereby forming active intermediates (epoxides) that can bind to macromolecules and cause specific toxic effects. Conjugates of phenols, dihydrodiols, quinones, and anhydrides have been the principal metabolic products identified. The detailed metabolic profile varies with compound and species tested (IPCS, 1998; ATSDR, 2002). The complex metabolic reactions have been extensively studied with BaP (for a review, including a scheme of the proposed pathways, see also IPCS, 1998; ATSDR, 2002).
Metabolites detected or measured after coal tar creosote exposure include 1-naphthol, which is formed from naphthalene (Bakke et al., 1985; Keimig & Morgan, 1986; Tingle et al., 1993), and 1-pyrenol, which has pyrene as parent compound (Boyland & Sims, 1964; Keimig et al., 1983; Jongeneelen et al., 1985; Viau et al., 1995a). Both are used — with limitations — as indicators of coal tar creosote exposure by testing human urine samples (Jongeneelen et al., 1985, 1988b; Elovaara et al., 1995; Heikkilä et al., 1995, 1997; see also section 5.3). Their suitability as biomarkers for occupational creosote exposure has been discusssed in detail by Heikkilä (2001).
Danish creosote has been found to induce an enzyme involved in the glucuronidation of 1-pyrenol (Nylund et al., 1992).
Glucuronosyltransferase activity was assayed in liver microsome preparations from rats treated with creosote (200 mg/4 ml olive oil per kg body weight by gavage 72 and 24 h before sacrifice; n = 8). Results suggested a highly efficient form or forms of 3-methylcholanthrene-inducible phenol uridine diphosphate-glucuronosyltransferase(s), with significantly decreased Km and increased Vmax values compared with untreated controls (Luukkanen et al., 1997).
Metabolic pathways for phenolic compounds include conjugation, hydroxylation, and oxidation reactions (IPCS, 1994, 1995).
Little information is available on the excretion pattern of coal tar creosote. What information is available refers to PAH metabolites in human urine.
Generally, metabolized (and some unmetabolized) PAHs are excreted into bile and faeces and, to a lesser extent, into urine, regardless of route of absorption. From there, reabsorption via hepatobiliary circulation occurs. Frequently, the excretion behaviour of certain PAHs is influenced by the concomitant presence of other PAHs (IPCS, 1998; ATSDR, 2002).
Lipophilic PAHs are also excreted into breast milk (ATSDR, 2002).
The urinary excretion of metabolites has been studied in workers after creosote-derived exposure to naphthalene (Heikkilä et al., 1995, 1997), the most abundant compound in creosote vapour, and to pyrene (Jongeneelen et al., 1985, 1988b; Bos & Jongeneelen, 1988; Van Rooij et al., 1993a; Viau et al., 1993, 1995b; Elovaara et al., 1995; Heikkilä et al., 1995; Viau & Vyskocil, 1995), which is a less volatile creosote component.
Concentrations of naphthalene and its metabolite 1-naphthol have been determined in workplace air (personal air samples) and in urine of six workers, respectively, from a creosote impregnation plant in Finland, where railroad ties were impregnated with coal tar creosote. The mean naphthalene concentration during the workweek was 1.5 mg/m3 (range: 0.4–4.2 mg/m3). The corresponding urinary concentration of 1-naphthol at the end of the workshift ranged from 3.5 to 62.1 µmol/litre, with a mean of 20.5 µmol/litre, whereas the urinary concentration of the reference group (n = 5 occupationally non-exposed male smokers) was below the detection limit (0.07 µmol/litre). The mean ratio of 1-naphthol excretion (mol/24 h) to the respiratory uptake of naphthalene (estimated from an arbitrary lung ventilation of 25 litres/min and 50% retention) per workshift has been calculated to be 17% (SD 9%). The estimated daily uptake of naphthalene by inhalation correlated moderately with the 1-naphthol excretion over 24 h. Possibly, there is also some additional uptake of naphthalene through the skin or via ingestion (Heikkilä et al., 1997). The correlation between 1-naphthol concentrations in the urine of three assemblers monitored over 5 consecutive days and naphthalene air concentrations was poor (correlation coefficient, r < 0.5) (Heikkilä et al., 1995).
For 1-pyrenol and its parent compound pyrene, no correlations have been found between concentrations in urine and concentrations in workplace air (mean: 0.97 µg/m3, range: 0.23–2.2 µg/m3), respectively, in the wood impregnation worker study group (the same as monitored by Heikkilä et al., 1997). That was explained by the higher uptake of pyrene via the dermal route. The daily output of urinary 1-pyrenol (281–1551 nmol/day) exceeded the daily uptake of inhaled pyrene (30–91 nmol/workshift) by up to about 50-fold in the six workers. Urinary 1-pyrenol concentrations ranged from 4 to 122 µmol/mol creatinine, demonstrating a very high maximum (compared with literature data [e.g., mean (SD): 0.27 (0.24) µmol/mol creatinine measured in people (n = 27) from urban and rural areas in Estonia]; a control group was lacking) (Elovaara et al., 1995).
Elevated urinary levels of 1-pyrenol have also been found in employees of other creosote-impregnating plants (Jongeneelen et al., 1985, 1988b; Bos & Jongeneelen, 1988; Jongeneelen, 1992; Van Rooij et al., 1993a; Viau et al., 1993, 1995b) and in assemblers handling creosote-impregnated wood (Heikkilä et al., 1995). The maximum daily urinary 1-pyrenol excretion found for the three assemblers monitored from Monday to Monday amounted to 25.1 µmol/mol creatinine. The excreted amounts of 1-pyrenol were (on a molar basis) 4–51 times higher than the corresponding estimated pyrene inhalation doses (basing on a mean pyrene concentration of 0.4 µg/m3 in the breathing zone of the assemblers), thus indicating non-inhalative routes of uptake (Heikkilä et al., 1995).
In all cases, the excretion patterns of 1-pyrenol could be related to the specific working conditions of the workers. The background levels for control groups were low. For example, the 1-pyrenol concentrations in spot urine samples from 21 non-occupationally exposed individuals ranged from 0.002 to 0.57 µmol/mol creatinine (geometric mean: 0.08 µmol/mol creatinine). Other control groups had a geometric mean of 0.07 µmol/mol creatinine for non-smokers (n = 95) and 0.12 µmol/mol creatinine for smokers (n = 45) (Viau et al., 1993, 1995b).
The relevance of percutaneous pyrene uptake for 1-pyrenol excretion has also been demonstrated in workers (n = 10) of a wood impregnation plant in the Netherlands (Van Rooij et al., 1993a). The use of protective clothes (coveralls worn underneath normal workclothes) resulted in a reduction of pyrene skin contamination (measured by means of skin exposure pads) by about 35%, as well as a significant decrease in the amount of urinary 1-pyrenol. On the day (one Monday, after a weekend off) on which workers wore coveralls, the mean pyrene concentration in the air was 1.2 µg/m3; on the day without the coveralls (next Monday, after a weekend off), it was 0.9 µg/m3 (personal air samples). The median total pyrene skin contamination ranged between 47 and 1510 µg/day (median: 346 µg/day) without coveralls and between 39 and 433 µg/day (median: 185 µg/day) with coveralls. The corresponding urine samples (collected from Sunday morning to Tuesday morning, thus including an exposure period of 8 h) contained 6.6 µg 1-pyrenol (without coveralls) and 3.2 µg 1-pyrenol (with coveralls). Altogether, there was a high correlation between dermal exposure and urinary excretion, but a low correlation between air concentration of pyrene and urinary excretion of 1-pyrenol. It should be noted that the extra protective clothing was not very effective in reducing pyrene skin contamination (an average of about 35%, as stated above). The most important explanations given by the authors related to the uncovered skin areas, such as the face, wrists, and ankles, and to contamination by air sucked between the skin and coveralls.
Patterns of 1-pyrenol excretion have been studied in two male volunteers exposed to a single dose of 100 µl creosote (no specification given) by the dermal route (topical application to the inner face of the forearms). This treatment enhances the basal excretion by approximately 20-fold, with excretion peaks occurring in the urine between 10 and 15 h after application (Viau & Vyskocil, 1995).
Elimination kinetics have been calculated on the basis of concentrations of 1-pyrenol in urine (sampled over a 17-day period) of an operator in a creosote impregnating plant (Jongeneelen et al., 1988b) and of 1-pyrenol and 1-naphthol in urine (sampled over an 8-day period) of assemblers (n = 2) handling creosote-impregnated wood (Heikkilä et al., 1995). The excretion process seems to be biphasic. A fast-excreting component with a half-life of 1–2 days and a slow-excreting component with a half-life of 16 days have been calculated for 1-pyrenol (Jongeneelen et al., 1988b).
Another study showed that even after more than 64 h without exposure, creosote workers (n = 19) in a wood treatment plant excreted more 1-pyrenol than the referent groups (n = 19). Creosote workers had a geometric mean excretion of 1.63 (0.18–10.47) µmol/mol creatinine during their workweek compared with a geometric mean of 0.08 µmol/mol creatinine for the referent group (Viau et al., 1995b).
In a study with two volunteers treated topically with creosote (100 µl; left in contact with forearm skin for 1 h), first-order apparent elimination half-lives of about 12 h were calculated for 1-pyrenol, which was analysed in urine collected for a period of 48 h after application (Viau & Vyskocil, 1995).
Studies on reactions of creosote with body components principally refer to interactions of creosote PAHs with nucleic acids. Such reactions are suggested to play an important role in carcinogenicity and are well documented for PAHs including BaP (e.g., IPCS, 1998; Culp et al., 2000) and complex mixtures such as coal tar, bitumen, diesel exhaust, etc. (e.g., Mukhtar et al., 1986; Schoket et al., 1988a,b; Springer et al., 1989; Gallagher et al., 1990; Phillips et al., 1990a,b; Weyand et al., 1991; Leadon et al., 1995; Lyons et al., 1997; Reddy et al., 1997; Culp et al., 2000).
PAH–DNA adducts have been detected in mice (Schoket et al., 1988a; Phillips et al., 1990a; Randerath et al., 1996), rats (Chadwick et al., 1995), fish (Collier et al., 1993; Ericson et al., 1998, 1999; Rose et al., 2000), and humans (Schoket et al., 1988b; Phillips et al., 1990a; Roggeband et al., 1991) after experimental, environmental, or occupational exposure to creosote.
Following topical application of creosote (commercial preparations purchased from local hardware shops; 25 µl or 5 µl diluted to 150 µl with ethanol; single and multiple doses) to male Parkes mice, significant levels of PAH–DNA adducts were formed in mouse skin. The levels measured 24 h after a single dose declined in a biphasic manner (first phase: removal of one-half to two-thirds of initial levels of adducts by 7 days; second phase: removal of one-half to two-thirds of the remainder in the succeeding 25 days). After multiple topical doses, a steady increase in the formation of PAH–DNA adducts was seen in skin during the course of the 5-week treatment (with dosing on the 1st and 4th days of each week). Interestingly, a similar accumulation of PAH–DNA adducts was seen in lung tissue, indicating a significant systemic transport. The adduct levels in lung were approximately half those attained in skin. A detailed identification of individual PAH adducts has not been performed (Schoket et al., 1988a; Phillips et al., 1990a). Dermal treatment (once per day for 2 days; sacrifice 24 h later) of female mice (n = 3 per group) with an extract (solvent: hexane/acetone = 1/1, v/v) of samples from a wood-preserving waste site in the USA (containing coal tar creosote, PCP, and other polychlorinated aromatics) also resulted in PAH adducts in several tissues, such as skin, lung, liver, kidney, and heart, with tissue-specific levels. One of the major adducts was a BaP adduct, whose levels in the five tissues correlated linearly with total adduct levels (Randerath et al., 1996).
Formation of DNA adducts has been observed in the liver of male Fischer 344 rats (n = 6) gavaged daily with 50 mg creosote/kg body weight (lot/batch CX1984, obtained from the National Toxicology Program Repository, USA, prepared by Radian Corporation; Texas, USA; carrier: peanut oil) for 5 weeks. There was also a significant interaction between creosote and 2,6-dinitrotoluene (DNT). Pretreatment of rats with creosote resulted in a significant (66%) increase in the formation of DNT-derived DNA adducts in the livers of rats compared with animals dosed with DNT alone (Chadwick et al., 1995).
The levels of PAH–DNA adducts in the liver of feral fish (oyster toadfish, Opsanis tau; n = 5) sampled from the Elizabeth River (Virginia, USA) were highly correlated with concentrations of PAHs (0.01–100 mg/kg dry weight) in surficial sediments at the capture sites, showing maxima at a site near an old creosote plant (Collier et al., 1993). High DNA–PAH adduct levels were also found in liver and extrahepatic tissues (anterior kidney, spleen, and blood) of mummichog (Fundulus heteroclitus, n = 4) collected from a creosote-contaminated site in the Elizabeth River (Rose et al., 2000). Hepatic DNA adducts have also been measured in wild fish (perch, Perca fluviatilis; n = 9) from a site in a Swedish river whose bottom sediments were heavily contaminated with creosote originating from a former wood treatment facility (total PAH concentrations of up to 1968 mg/kg dry weight in the sediment, 0–5 cm, at earlier measurements). The adduct levels were found to be significantly increased compared with several reference sites. In the laboratory, perch (n = 7) were exposed to an organic solvent extract prepared from the creosote-contaminated sediment (total PAH concentration: 48 mg/kg dry weight) by repeated oral administration (each dose: 13 mg PAHs/kg body weight; four doses given with an interval of 4 days; sacrifice: 4 days after the last dose). Resulting adduct patterns were very similar to those observed in perch from the contaminated field site. One of the adducts was tentatively identified as a BaP adduct (Ericson et al., 1998, 1999).
The formation of DNA adducts has been demonstrated in humans as well. White blood cells collected from workers exposed to creosote showed an increase in PAH–DNA adducts during the workweek (Roggeband et al., 1991; see also section 5.3). Adult (n = 10) and fetal (n = 9) human skin explants maintained in short-term organ culture and treated topically with creosote (purchased from local hardware shops; 25 µl diluted to 150 µl with ethanol for application; single dose) developed, within 24 h, levels and patterns of adducts similar to those seen in in vivo tests with mouse skin. The mean levels of adducts in creosote-treated fetal skin were lower than those in adult skin (Schoket et al., 1988b; Phillips et al., 1990a).
Generally, there are also attempts to use such measurements as biomarkers of PAH exposure (Randerath et al., 1996; Lewtas et al., 1997; Lyons et al., 1997 and references therein; Godschalk et al., 1998; Koganti et al., 1998; Reichert et al., 1998).
There are some data on acute toxicity of creosote available for rats (Pfitzer et al., 1965; IRI, 1979, 1981, 1982; Willeitner & Dieter, 1984; Atochem, 1992a; RTECS, 1999), mice (Morita et al., 1997; RTECS, 1999), rabbits (Pfitzer et al., 1965), and farm animals (Harrison, 1959). Most of the studies show low to moderate acute oral toxicity and low acute dermal toxicity, but often they do not meet current standards and are incompletely reported (see also Table 27).
Table 27: Summary of LD50 values for creosote.
|
Creosotea |
Route |
Species |
LD50 |
Remarksa,b |
Reference |
|
Coal tar creosote |
Oral |
Rat |
1700 |
* |
Pfitzer et al. (1965) |
|
Coal tar creosote |
Oral |
Rat |
3800 |
95% CI: 2900–5100 mg/kg body weight |
IRI (1979) |
|
Coal tar creosote |
Oral |
Rat |
|
* |
Willeitner & Dieter (1984) |
|
Coal tar creosote (Creosote speciale 14130) |
Oral |
Rat |
2524 |
OECD Guideline 401 |
Atochem (1992) |
|
Coal tar creosote |
Oral |
Rat |
725 |
* |
RTECS (1999) |
|
Coal tar creosote |
Oral |
Mouse |
433 |
* |
RTECS (1999) |
|
Coal tar creosote |
Oral |
Sheep |
4000 |
total n = 5 |
Harrison (1959) |
|
Coal tar creosote |
Oral |
Calf |
>4000 |
total n = 2 |
Harrison (1959) |
|
Coal tar creosote |
Intraperitoneal |
Mouse |
470 |
Lorke’s method, 4 days, males |
Morita et al. (1997) |
|
Coal tar creosote |
Dermal |
Rabbit |
>7950 |
LOAEL: >15 800 mg/kg body weight |
Pfitzer et al. (1965) |
|
Coal tar creosote |
Dermal |
Rat |
|
* |
Willeitner & Dieter (1984) |
|
Coal tar creosote |
Dermal |
Rat |
>2000 |
* |
IRI (1982) |
|
a |
Abbreviations used: AWPA = American Wood-Preservers’ Association; CI = confidence interval; i.a. = impregnating agent; LOAEL = lowest-observed-adverse-effect level; n.s. = no specification; OECD = Organisation for Economic Co-operation and Development. |
|
b |
An asterisk (*) indicates that no further details were specified. |
Rats (five males, five females) survived a 4-h exposure by inhalation to creosote vapour (AWPA P1-65) generated by heating to 50 ºC. Effects included depressed respiration rate and a semicomatose condition. A gradual recovery was observed within a number of hours after treatment. There were (unspecified) pathological changes, which (except for the presence of focal chronic pneumonitis in seven of the animals) were reversible 14 days after treatment (IRI, 1981). Another inhalation test with rats resulted in no deaths following an exposure of 1 h to creosote-saturated air vapours (0.033 ml/litre air, no further details given; von Burg & Stout, 1992).
Oral LD50 values in rats ranged from 725 mg/kg body weight (RTECS, 1999) to 5430 mg/kg body weight (Willeitner & Dieter, 1984) (see also Table 27). The only value available for mice was 433 mg/kg body weight (RTECS, 1999; see also Table 27). Clinical symptoms have not been reported in the rodents. A sheep dosed with 8000 mg/kg body weight (given as a suspension in sawdust and water by stomach tube) died within 4 days, whereas a calf dosed with 4000 mg/kg body weight showed heavy loss in body weight within 4 days following dosing but survived. There were no well-defined clinical symptoms (e.g., dullness) or postmortem findings; urine was dark in colour, with a pronounced tarry odour. At necropsy of the sheep, there was a strong smell of creosote in the stomach and intestines, but no signs of congestion or irritation; the pleural cavity contained excess clear fluid (Harrison, 1959; see also Table 27).
Intraperitoneal administration resulted in an LD50 of 470 mg/kg body weight in mice (Morita et al., 1997; see also Table 27).
The dermal LD50 values were greater than 2000 mg/kg body weight in rats and rabbits (Pfitzer et al., 1965; IRI, 1982; Willeitner & Dieter, 1984; see Table 27).
There is little reliable information available regarding effects of coal tar creosote in experimental animals after repeated exposure. No short-term studies on inhalation exposure to creosote were available.
The studies on oral exposure to creosote are limited. Oral treatment (gavage) of male Fischer 344 rats (n = 6) with 50 mg coal tar creosote (in peanut oil)/kg body weight per day over 1–5 weeks (creosote obtained from the National Toxicology Program Repository, USA, lot/batch CX1984) produced no changes in the weights of the small intestine, large intestine, or caecum. The body weight was significantly reduced (6.75%) after the first week of treatment, but not by weeks 3 and 5. Some intestinal enzyme activities were found to be altered after 1, 3, and 5 weeks of treatment; for example, caecal beta-glucuronidase activity was increased and small intestinal nitroreductase activity was reduced (Chadwick et al., 1995). Treatment of male Wistar rats (n = 8) with Danish creosote (composition given by Nylund et al., 1992); 200 mg/kg body weight in 4 ml of olive oil) by gavage 72 and 24 h before death resulted in a significant increase in absolute and relative liver weights (Luukkanen et al., 1997).
Female ICR mice treated on gestation days 5–9 with petroleum creosote (dissolved in DMSO; coal tar-derived but called petroleum creosote by author; creosote refined CX1984; Matheson, Coleman and Bell Manufacturing Chemists, Norwood, Ohio, USA) at 400 mg/kg body weight per day and sacrificed on day 17 of gestation showed no changes in mean weights of livers, kidneys, lungs, and adrenals. Body weight gains were significantly lowered (by 16%) in both the group administered creosote (n = 20) and the group administered the solvent alone (n = 23), compared with untreated controls (n = 29) (Iyer et al., 1993).
Three sheep were administered daily oral doses of creosote (of the grade used for commercial timber preservation in New Zealand; suspended in water and sawdust) at approximately 500, 1000, and 2000 mg/kg body weight (corresponding to approximately one-half, one-quarter, and one-eighth of the acute lethal dose rate). The sheep receiving the lowest dose rate (for 32 days) as well as the two controls, one given untreated sawdust (for 12 days), showed no ill effects. The two sheep treated with the higher concentrations rapidly lost weight and died on the 16th day (1000 mg/kg body weight per day) or 8th day (2000 mg/kg body weight per day). Other clinical symptoms were loss of appetite and weakness. Postmortem findings included some hyperaemia or patchy inflammation of the mucous membranes of the colon and duodenum, excess peritoneal fluid, extensive petechiation of the epicardium, enlargement of lymph glands of the head, and enlargement of the thyroid. The contents of the stomach and intestines had a strong smell of creosote. There were no significant histological findings reported (although details of the extent of examination were not given).
A calf administered (orally) 500 mg creosote/kg body weight per day for 11 days lost weight. Severe loss of weight and "poor condition" were reported for a second calf given 1000 mg/kg body weight per day for 11 days. Weight loss in this animal continued for 3 weeks following cessation of treatment, although 45 days after the start of the trial, while still emaciated, its condition was said to be improving (Harrison, 1959).
Some older experimental studies with mice indicated a carcinogenic activity of creosotes after topical application (Woodhouse, 1950; Lijinsky et al., 1957; Poel & Kammer, 1957; Boutwell & Bosch, 1958; Roe et al., 1958; see also Table 28). Types of tumours included not only skin carcinomas and papillomas, but also lung carcinomas. In some cases, the studies were, however, limited, having small numbers of test animals, lack of controls, insufficient dose information, poor specification of creosotes, etc.; none of the studies provided dose–response relationships.
Table 28: Summary of carcinogenicity studies on coal tar creosote.
|
Creosote / study designa |
Duration |
Tumour type, incidence [other effects] |
Latency period |
Comments |
Reference |
|
Coal tar creosoteb / dermal, mouse, males/females (n = 25/25), twice weekly: concentration n.sp. (covering an area of about 1.5 cm in diameter) |
25 weeks |
Skin carcinomas in 9 of 19 surviving mice; papillomas in 10/19; deaths: 31 |
n.sp. |
Untreated control lacking (however, no tumours with pine oil and linseed oil) |
Woodhouse (1950) |
|
Coal tar creosote (creosote 1 oil from a Wilton still)c / dermal, mouse (Swiss), female, n = 30, 1 drop of undiluted creosote oil twice weekly over 70 weeks |
70 weeks |
Skin tumours in 13/26 females; more than 1 tumour per animal occurring (a total of 23 tumours, 16 malignant) |
50 weeks |
Only 1 dose, semiquantitative dose information, specific control group lacking |
Lijinsky et al. (1957) |
|
Coal tar creosote (blended oilb) / |
About 44 weeks |
Skin tumours in 8/8 females at both doses (malignant 7/8) versus 0/10 in controls, metastases to lung or regional lymph nodes |
18–23 weeks |
BaP not detected in test samples |
Poel & Kammer (1957) |
|
Coal tar creosote (light oilb) / dermal, mouse (C57L), male, n = 11, 1 drop (0.009 ml) of 50% creosote (in toluene) 3 days/week for life span or until first papilloma developed at the site of application |
About 45 weeks |
Skin tumours in 11/11 males (male-specific control group lacking) |
21–25 weeks |
BaP not detected in test samples |
Poel & Kammer (1957) |
|
Coal tar creosote (Carbasota,b,d USA) / dermal, mouse (Sutter), female, n = 30, 1 drop (25 µl) twice weekly |
Boutwell & Bosch (1958) |
||||
|
- for 4 weeks |
44 weeks |
No skin tumours |
18 weeks (1st appearance) |
||
|
Coal tar creosote (Carbasota,b,,d USA) / dermal, mouse (Sutter), sex: n.sp. |
n.sp. |
Only 1 concentration tested; lung tumours a more sensitive end-point than skin tumours |
Roe et al. (1958) |
||
|
- n = 19–24, 1 drop (25 µl) twice weekly from 3 weeks until 6 months of age |
8 months |
139 lung tumours in 24 mice (5.8 adenomas/mouse) vs. 9/19 (0.5 adenomas/mouse) in controls |
|||
|
- n = 29, 1 drop (25 µl) (after weaning) twice weekly for 5 months (plus born and kept in creosoted cages) |
8 months |
315 lung tumours in 29 mice (10.8 adenomas/mouse) |
|||
|
Skin/lung tumours (combined results from both groups, n = 24 + 29): 5/53 skin+/lung-; 9/53 skin-/lung+; 39/53 skin+/lung+ |
|||||
|
- n = 23, 1 drop twice weekly for 4 weeks (9 times in all) |
10 months |
37 lung tumours in 23 mice (1.6 adenomas/mouse), no skin tumours (0.3 adenomas/mouse) |
|||
|
Coal tar creosote (CTP1)e / dermal, mouse (CD-1), male, n = 62, 25 µl of 0.1, 1, 3, and 9 mg CTP1 (in toluene) per application (corresponding to 0.2, 0.5, 1.4, and 4.1 mg BaP/kg) twice weekly over 78 weeks |
78 weeks = 546 days |
Skin tumours in 1/62 and 2/62 mice of the two highest dose groups vs. 0–1/62 in controls, statistically not significant |
212–478 days (1st appearance) |
Buschmann et al. (1997)f |
|
|
Coal tar creosote (CTP 2)e / dermal, mouse (CD-1), male, n = 61–62, 25 µl of 0.1, 0.3, 1, 3, and 9 mg CTP2 (in toluene) per application (corresponding to 13, 3.8, 12.6, 37.6, and 113 mg BaP/kg) twice weekly over 78 weeks |
78 weeks = 546 daysg |
Skin tumours (statistically significant) in 9/62, 23/62, and 20/61 mice of the 1, 3, and 9 mg dose groups |
38–366 days |
Correlation to BaP content |
Buschmann et al. (1997)f |
|
a |
Abbreviations used: n = number per group; dermal = epicutaneous route; n.sp. = not specified. |
|
b |
No specification. |
|
c |
Containing 2.75 g benz[a]anthracene/litre. |
|
d |
Manufactured by Barrett Chemical Co., USA. |
|
e |
Manufactured by Rütgers VfT AG, Germany (for composition, see section 2), CTP1 containing 10 mg BaP/kg, CTP2 containing 275 mg BaP/kg. |
|
f |
Cited as the Fraunhofer study (1997) in Mangelsdorf et al. (1998). See also Table 29. |
|
g |
Experiments with the 9 mg dose group were terminated after 274 days. |
A 78-week dermal carcinogenicity study was conducted with two samples of coal tar creosote with different BaP contents (Buschmann et al., 1997; see also Tables 28 and 29). Two different creosote samples were tested: creosote 1 (CTP1) and creosote 2 (CTP2) contained 10 and 275 mg BaP/kg, respectively. Both samples were diluted with toluene before being applied to CD1 male mice (62 per group). The BaP contents of the applied solutions were as follows: CTP1: 0.2, 0.5, 1.4, and 4.1 mg/kg; CTP2: 1.3, 3.8, 12.6, 37.6, and 113 mg/kg. The animals were treated with 25 µl of solution twice a week over a period of 78 weeks. Treatment in some animals had to be interrupted due to ulceration. In the high-dose group (CTP2; 113 mg/kg), there was a reduced survival time of animals. For this dose group, the study was terminated after 274 days.
Table 29: Scheme of the 1997 mouse skin carcinogenicity study (Buschmann et al., 1997).a,b
|
C1 |
C2 |
CTP1 |
CTP2c |
BaPc |
||||||||
|
Creosote test solutions |
||||||||||||
|
mg creosote/treatment |
0 |
0 |
0.3 |
1 |
3 |
9 |
0.1 |
0.3 |
1 |
3 |
9d |
– |
|
BaP concentration applied (mg/kg) |
0 |
0 |
0.2 |
0.5 |
1.4 |
4.1 |
1.3 |
3.8 |
12.6 |
37.6 |
113d |
348 |
|
µg BaP/treatment |
0 |
0 |
0.003 |
0.01 |
0.03 |
0.09 |
0.03 |
0.08 |
0.3 |
0.8 |
2.5d |
7.5 |
|
Total BaP (µg/mouse: |
0 |
0 |
0.5 |
1.6 |
4.7 |
14 |
3.9 |
12 |
42 |
128 |
384d |
1170 |
|
General records |
||||||||||||
|
Number of treated animals |
62 |
62 |
62 |
62 |
62 |
62 |
62 |
62 |
62 |
62 |
61d |
62 |
|
Mean lifetime (days) |
494 |
470 |
493 |
483 |
471 |
447 |
504 |
473 |
444 |
407 |
249d |
477 |
|
First appearance of suspected papilloma (days)e |
512 |
– |
– |
394 |
240 |
212 |
345 |
114 |
121 |
163 |
72d |
184 |
|
First appearance of suspected carcinomas (days)e |
– |
– |
– |
– |
478 |
– |
534 |
485 |
38 |
366 |
– |
351 |
|
Number of mice with non-malignant skin tumours |
1 |
0 |
0 |
0 |
0 |
2 |
0 |
2 |
6 |
12* |
16*d |
27* |
|
Number of mice with malignant skin tumours |
0 |
0 |
0 |
0 |
1 |
0 |
1 |
1 |
3 |
16* |
6*d |
32* |
|
Number of mice with skin tumours (malignant and non-malignant) |
1 |
0 |
0 |
0 |
1 |
2 |
1 |
3 |
9* |
23* |
20*d |
47* |
|
Number of mice with more than one skin tumour |
0 |
0 |
0 |
0 |
0 |
0 |
0 |
0 |
0 |
5 |
2d |
18 |
|
Total number of tumours |
1 |
0 |
0 |
0 |
1 |
2 |
1 |
3 |
9 |
28 |
22d |
68 |
|
a |
Cited as the Fraunhofer study (1997) according to Mangelsdorf et al. (1998); dosage regimen and further details as described in Table 28; application on clipped skin. |
|
b |
Abbreviations used: C1, C2: negative controls; CTP1 = coal tar creosote 1 (containing 10 mg BaP/kg); CTP2 = coal tar creosote 2 (containing 275 mg BaP/kg). |
|
c |
An asterisk (*) indicates statistical significance, P < 0.05. |
|
d |
Terminated after 274 days (instead of 546 days) because of severe skin lesions, so fewer than the scheduled 384 applications were given. |
|
e |
Type of tumour given from visual inspection; therefore, no clear distinction between benign and malignant tumours possible. |
Squamous cell carcinomas and papillomas were observed from both preparations. These tumours were seen at the site of application only. Other organs were not investigated. A dose-related, statistically significant (P < 0.05) increase in tumour rate was found for CTP2. For CTP1, at the dose level with the highest BaP concentration of 4.1 mg/kg, there was an increase in tumour rate that was not statistically significant (Buschmann et al., 1997).
This study was evaluated for the German Ministry of the Environment (Mangelsdorf et al., 1998). The rationale for the calculation of the risk assessment is given in Appendix 1. According to this analysis, the ulcerations are not the primary cause of the tumours, as there was no difference in the tumour rate between animals with or without ulceration for the same dose level. For the calculation of the risk, only those animals for which the treatment was not interrupted due to ulcerations were taken into account. After correction for the reduced survival time, a linear relationship between observed tumour rate and BaP content of the solution of both CTP samples was found.
A value of 4.9 × 10⁻³ tumours/(animal × µg BaP) was found for the slope of the curve that, for both samples of creosote, describes the relationship between the increased number of skin tumours compared with the control and the total amount of BaP (creosote) applied during the course of treatment.
From this study, a lifetime risk for dermal cancer incidence of about 10–4 has been derived for creosote, corresponding to a BaP dose of 1 ng/kg body weight per day (CSTEE, 1999):
|
Slope factor |
= |
4.9 × 10⁻³/µg BaP for the whole length of treatment (546 days) |
|
= |
2.7/µg BaP per day |
|
|
= |
1.3 × 10⁻¹/µg BaP per kg body weight per day (mouse weighs 0.02 kg) |
|
|
= |
1.3 × 10⁻⁴/ng BaP per kg body weight per day |
This has also been calculated with the same result using the T25 (daily dose inducing a tumour incidence of 25% upon lifetime exposure) method.
Based on its BaP content, the tumorigenic effect of creosote appeared to be 5 times greater than its BaP content alone would have predicted. This was concluded from a comparison of tumour incidence in mice treated with the creosote solutions with that in a parallel positive control, in which mice were treated with a solution of pure BaP.
Non-neoplastic effects observed in this long-term study included skin ulcerations and decreases in life span (see Tables 28 and 29).
In a tumour-initiating test, female Sutter mice (n = 30) were treated topically with 1 drop of undiluted creosote (Carbasota, Barrett Chemical Company, USA) twice a week for 1 month; after an interval of 1 week, croton oil (25 µl of a 0.5% solution in benzene) was applied twice weekly for an additional 51 weeks. Whereas no tumours developed in the control groups (control 1: creosote alone applied for 1 month with an observation period of 44 weeks; control 2: croton oil alone for 44 weeks), 46% of mice from the initiating test group developed malignant skin tumours (Boutwell & Bosch, 1958). Similar coal-derived liquids also showed tumour-initiating activity in CD-1 mice (Mahlum, 1983; Mahlum et al., 1984).
Some fractions of creosote (chemical composition not specified; vehicle: benzene) painted onto the skin of female mice (n = 20; twice weekly, for a total of 72–145 applications) have been found to increase the tumorigenic action of BaP with respect to both number of skin tumours and latency period (Cabot et al., 1940; Sall & Shear, 1940). An artificial mixture consisting of five creosote PAH components (anthracene, chrysene, pyrene, fluoranthene, and phenanthrene) has been tested in a 2-year carcinogenicity mouse skin bioassay. A toluene solution containing 0.1% of each of the five PAHs produced tumours in 23% of the mice (male C3H/HeJ mice; n = 20) with a latency period of 73 weeks. With the addition of 0.001% of BaP to the above solution, 47% of the mice produced tumours with a latency period of 66 weeks. Additionally, a coal tar solution in toluene (containing 0.0006% BaP) produced tumours in 51% of mice with a latency period of 73 weeks. Both concentrations of BaP administered in toluene by themselves did not produce skin tumours (Warshawsky et al., 1993). In contrast, no increase in skin tumour formation was observed in mice (female Charles River CD-1; n = 27–30) after topical co-administration of BaP and selected coal distillates, compared with administration of BaP alone (Springer et al., 1989).
Carcinogenicity of creosote after inhalation or oral/dietary exposure has not been studied. Dietary exposure of female B6C3F1 mice over 2 years to similar mixtures (e.g., coal tar samples from manufactured gas plant waste sites) resulted in dose-related increases in several types of tumours, including liver carcinomas, forestomach squamous epithelial papillomas and carcinomas, alveolar/bronchiolar adenomas and carcinomas, and small intestine adenocarcinomas (Culp et al., 1998). The BaP content within these coal tar diet mixtures has been found to be only partially indicative of the tumour formation observed (Goldstein et al., 1998; Culp et al., 2000; Gaylor et al., 2000).
Of the individual components of creosotes, at least several PAHs are established carcinogens — for example, benz[a]anthracene, BaP, benzo[k]fluoranthene, and chrysene (IPCS, 1998). There are also indications of carcinogenicity for some heterocyclic compounds — for example, carbazole (Weyand et al., 1993; IARC, 1999), quinolines (La Voie et al., 1988; Weyand et al., 1993), and thiophenes (Tilak, 1960). Some phenolic compounds may have promoting activity (IPCS, 1994, 1995).
In a creosote-contaminated environment, hepatocellular carcinomas and adenomas have been reported in fish (see section 9).
Skin irritation has been tested for two German creosotes. Impregnation agent DB and impregnation agent Z showed Draize-score indices of 2.2 and 1.9, respectively. Both were classified as non-irritants regarding primary/24 h skin irritation (Willeitner & Dieter, 1984). A French creosote (14130) tested according to OECD Guideline 404 has been found to be irritating to the skin (Atochem, 1992b). Another creosote (USA, 64-451B) has been classified as a primary skin irritant, with a primary skin irritant score of 6.1 (Pfitzer et al., 1965).
Skin irritation has been observed in the mouse tail skin test with certain fractions of creosote; however, type of creosote, composition of fractions, and dose levels have not been specified (Wrench & Britten, 1975).
A single application of 25 ml of creosote (manufacturer not given) to the clipped skin (over jaw area) of a calf caused skin changes such as swelling, hardening, and creasing. Dry, crusty thickening of the skin persisted for more than 4 weeks (Olafson & Leutritz, 1959).
Instillation of undiluted coal tar creosote (0.1 ml; no further details reported) in the eyes of rabbits elicited a redness of the conjunctiva with congested vessels that resolved within 7 days (Pfitzer et al., 1965). No primary eye irritation has been found with the two German creosotes (tested according to European Commission regulations from 1983; Willeitner & Dieter, 1984) and the French creosote (tested according to OECD Guideline 405; Atochem, 1992c) mentioned above.
Photosensitization (sensitization of the skin to UV light by creosote) has been observed in workers exposed to creosote (see section 8.2), but experimental animal studies with creosote are not available. However, this phenomenon has been well documented for coal tar and related mixtures and several compounds (e.g., anthracene, BaP, pyrene, acridine) present in coal tar and coal tar creosote (Kochevar et al., 1982; Comaish, 1987; IPCS, 1998; ATSDR, 2002).
A coal tar creosote (partial specification: 15 PAHs) did not significantly increase absolute or relative uterine wet weight or vaginal cornification in immature and mature ovarectomized ICR mice (n = 4–6) or DBA/2 mice (n = 5–7). The animals received oral doses (by gavage) once every 24 h for 4 days and were sacrificed on day 5. The doses consisted of 0.1 ml sesame oil containing creosote at 0.1, 10, 50, or 100 mg/kg body weight (Fielden et al., 2000).
A preliminary study with petroleum creosote (coal tar-derived; lot CX1984; dissolved in DMSO) administered by gavage to pregnant ICR mice on days 5–9 of gestation at a single dose (400 mg/kg body weight per day; n = 20–29; sacrifice: day 17 of gestation) did not find significant differences in skeletal and visceral malformations among the experimental groups (untreated; creosote treated; solvent alone treated). The number of live fetuses, number of dead fetuses, number of resorptions, and sex ratio in the live fetuses were similar in all groups. Maternal body weights were significantly lowered in the creosote- and solvent-treated groups. There were also unexpected signs of overt maternal toxicity by gestation day 9 in creosote-treated animals — so that treatment was not continued until day 14 of gestation (Iyer et al., 1993).
To date, studies with rodents at lower dose levels over additional days of gestation or studies conducted according to current guidelines are not available.
An experiment with pregnant pigs held on wooden platforms treated with coal tar creosote (no specification; at least three brush applications of a commercial creosote; duration of drying before confinement of the sows: 24–48 h) resulted in adverse developmental effects. The sows (n = 4) in contact with the creosoted platforms for 2–10 days prior to delivery delivered a number of dead newborns (24 of 41). The surviving pigs were rough and dehydrated and had rough skins and severe diarrhoea; 11 baby pigs died by day 3 post-farrowing. The weight gains were reduced over a 6-week period. Signs of maternal toxicity were not reported. In a control exposure with four pregnant sows held on untreated wooden platforms, 1 of 36 newborns was dead on delivery and 3 died post-farrowing, probably due to crushing (Schipper, 1961).
Embryotoxicity of petroleum creosote (coal tar-derived; lot CX1984; dissolved in DMSO) has been studied in a mouse preimplantation embryo culture system. ICR mouse embryos (n =15) collected on day 3.5 of gestation (blastocyst stage) were exposed for 1 h to different concentrations of creosote in serum-supplemented culture medium with and without rodent hepatic S9 microsomal fractions and subsequently cultured in control medium for 24–72 h. Embryonic viability varied inversely with petroleum creosote concentration. At 24 h, embryonic lethality was related to creosote concentrations: at 22 µg/ml of culture medium, there was no embryotoxic effect; at 33 µg/ml, there was a decrease in viability by 26–43%; and at 54 µg/ml, there were no viable embryos. Culture supplementation with rodent hepatic S9 microsomal fractions did not modify the embryotoxic effects. Embryos exposed to the intermediate exposure level showed a decreasing developmental potential with increasing time in culture (Iyer et al., 1992).
The Consultative Group was aware of animal studies on the developmental toxicity of creosote, which has been classified in Finland as a developmental toxicant, but the studies were not available to the Consultative Group.
In fish, developmental toxicity of creosote has been shown (see section 9).
A coal tar creosote (partial specification: 15 PAHs) has been examined in vitro for estrogen receptor-mediated activity using competitive ligand binding assays and reporter gene assays (Fielden et al., 2000). Creosote was found to bind to the mouse estrogen receptor, bind to the human sex hormone-binding globulin, and elicit partial agonist activity in reporter gene assays in transiently transfected MCF-7 cells (human mammary carcinoma-derived cells). The mouse competitive ligand binding assay (using uterine cytosol from female ICR mice) resulted in an IC50 value (displacement of the labelled ligand from the estrogen receptor) of 135 mg/litre creosote (compared with 7 µg/litre for 17beta-estradiol). Based on these values, it was estimated that creosote has a relative estrogenic potency of 0.000 165 and contains approximately 165 mg/litre of estradiol-equivalents. In the assay with human cells (human pregnancy serum), creosote displaced approximately 50% of the ligand at a concentration of 220 mg/litre; however, an IC50 value could not be determined, because full displacement curves could not be obtained due to the insolubility of creosote at higher concentrations. In the reporter gene assay, measuring luciferase activity, creosote induced luciferase activity by 36%, compared with the 100% response by 17beta-estradiol, at the highest concentration of 22 mg/litre. Because higher concentrations of creosote were cytotoxic, an EC50 for this end-point could not be calculated. Co-treatment tests showed that concentrations of creosote as low as 1 mg/litre had an additive effect on induction of luciferase by 17beta-estradiol (1 nmol/litre), whereas lower concentrations of creosote were not inhibiting or potentiating. Antiestrogenic effects of creosote (assayed via pS2-regulated gene expression in MCF-7 cells) could not be found (Fielden et al., 2000).
A number of the components of creosote (e.g., PAHs) are known to be mutagenic (IPCS, 1998).
A summary of in vitro genotoxicity assays carried out for various creosotes with bacterial (Ames/Salmonella test, assays with Escherichia coli) and mammalian (mouse lymphoma cell assay, sister chromatid exchange test with Chinese hamster ovary cells, chromosomal aberrations in human lymphocytes) test systems is given in Table 30 (Simmon & Poole, 1978; Bos et al., 1983, 1985; Nylund et al., 1992; IUCLID, 2000). Almost all creosotes tested showed mutagenic activity after metabolic activation (S9 mix) in the conventional Ames/Salmonella assay with strain TA98. Further, the nitroreductase overproducing strain YG1021 and the O-acetyltransferase overproducing strain YG1024 were tested, which have increased sensitivity to detect mutagenicity of aromatic nitro and amino compounds. Positive results were also obtained with several other Salmonella TA or YG strains or with the mouse lymphoma cell assay and the sister chromatid exchange test with Chinese hamster ovary cells. Negative results have been observed with the Salmonella tester strain TA1535 (which may be less sensitive in this case or indicative of other mutation types). Depending on creosote type tested, the Salmonella assay with tester strain TA100 as well as the SOS chromotest with Escherichia coli PQ37 gave positive and negative responses, thus indicating differences in mutagenic activity between different creosotes. There were also differences in the relative strengths of genotoxic responses. For example, Nylund et al. (1992), testing four creosote samples (about 85 components identified, 96–98% of total composition; see also Table 3: F, G) from different countries, found the same order of potency when the creosotes were tested both in the Ames/Salmonella assay using strains TA98 and YG1024 and in the sister chromatid exchange test with metabolic activation. The order of potency was: Danish > former Soviet > German > Polish creosotes.
Table 30: In vitro genotoxicity of several creosote samples.
|
Creosotesa tested |
Assay (end-point) |
Species/strain |
Results with metabolic activationb |
Reference |
|
Creosote P1 |
Salmonella assay |
TA1535 |
– |
Bos et al. (1983)c |
|
Creosote P1 |
Salmonella taped plate assayd |
TA1535 |
– |
Bos et al. (1985) |
|
Creosotes: |
Salmonella assay |
TA1535 |
–, – |
Simmon & Poole (1978) |
|
Creosotes: |
Salmonella assay |
TA98 |
+, +, +, + |
Nylund et al. (1992) |
|
Creosotes: |
Escherichia assay |
WP2 |
–, – |
Simmon & Poole (1978) |
|
Creosotes: |
SOS chromotest |
Escherichia coli PQ37 |
+,+, –, – |
Nylund et al. (1992) |
|
Creosotes: |
Lymphoma cell assay (TK +/–)e |
Mouse L5178Y |
+, + |
Simmon & Poole (1978) |
|
Creosotes: |
Sister chromatid exchange test |
Chinese hamster ovary cells |
+, +, +, + |
Nylund et al. (1992) |
|
Creosote speciale 14130 |
Chromosomal aberrations |
Human lymphocytes |
– |
Atochem (1991) |
|
a |
Creosote P1 = prepared by Cindu Chemicals, The Netherlands. |
|
Creosote P2 = mixture of coal tar and creosote. |
|
|
Creosote P1 and P2 = Creosotes type P-1 and type P-2 according to AWPA specifications (see section 2). |
|
|
Creosote speciale 14130 = manufactured by Atochem, France. |
|
|
Da, Ge, Po, So = Danish, German, Polish, former Soviet creosote (the first three creosotes conformed to British Standard 144/73; the creosote originating from the former Soviet Union was supplied by the Finnish Wood Preserving Association; for specifications, see Table 3). |
|
|
b |
According to creosote types tested. + = positive; (+) = slightly positive; – = negative. Metabolic activation with S9 mix. |
|
c |
Data on cytotoxicity were given only by Bos et al. (1983), reporting a 100% survival of Salmonella typhimurium TA98 and TA100 at 50 µg creosote per plate. |
|
d |
Modified Ames test for detection of volatile mutagens (according to Distlerath et al., 1984). |
|
e |
TK = thymidine kinase reversion. |
|
f |
According to OECD Guideline 474. |
In a two-stage transformation assay, creosote (no specification given) enhanced transformation of Syrian hamster embryo cells initiated with BaP, thus indicating tumour-promoting activities (Sanner & Rivedal, 1988).
Attempts have been made to identify the compounds or groups of compounds in different creosotes responsible for the mutagenic activity. As a result, several fractions of different creosotes have also been demonstrated to be mutagenic to Salmonella typhimurium TA98 in the presence of metabolic activation. The creosotes were fractionated by means of TLC (Bos et al., 1984a) or distillation (Nylund et al., 1992). Three of seven TLC fractions of creosote P1 were highly mutagenic: one contained unidentified more polar compounds, the second contained BaP, and the third contained benz[a]anthracene (Bos et al., 1984a). Both fractionation and mutagenicity profiles differed between the four different creosotes (Danish, German, Polish, former Soviet) tested by Nylund and co-workers. A common feature in the tests with Salmonella strains TA98 and TA100 (plus S9 mix) was that the mutagenicity appeared in the distillation fractions having the highest boiling point ranges (>290 °C) and high concentrations of known mutagenic PAHs (chrysene, benzo[e]pyrene, benzo[k]fluoranthene, BaP, dibenzo[a,h]anthracene, benzo[ghi]perylene). Although the intact creosotes contained lower concentrations of the six PAHs than these fractions, their mutagenic response was mostly higher; only a single fraction of one creosote showed slightly higher mutagenicity than the original creosote (Nylund et al., 1992).
Components suggested to be responsible for the mutagenicity of creosotes include mainly PAHs, but also aromatic amines and certain azaarenes (e.g., Sundström et al., 1986). Comparisons between mutagenic activities and concentrations of known mutagenic PAHs in several creosotes (see above) and some of their corresponding fractions suggested synergistic and antagonistic interactions (Nylund et al., 1992).
The mutagenic action of creosote (Cindu Chemicals, The Netherlands) vapour (generated at 37 °C) has been attributed to fluoranthene, based on the so-called taped plate assay with Salmonella strains TA98 and TA100 in the presence of S9 mix (Bos et al., 1987); however, this test was negative with the creosotes examined by Nylund et al. (1992).
Urine samples of rats injected intraperitoneally with 250 mg creosote/kg body weight showed elevated mutagenic activity in the Ames test with Salmonella typhimurium TA98 in the presence of metabolic activation and beta-glucuronidase (Bos et al., 1984b,c). The same test (metabolic activation not reported) was positive with urine samples from rats treated orally with creosote (lot CX1984; 50 mg/kg body weight per day) over a 5-week period (Chadwick et al., 1995).
Human urine samples collected from wood impregnation plant workers (n = 6) at the end of shift and tested according to the Ames Salmonella test with strain TA100 did not show any exposure-related increase in mutagenicity (Nylund et al., 1989). The same was true for urine samples from three workers of another wood impregnation plant, when tested with Salmonella strain TA98 (plus S9 mix and beta-glucuronidase): spot wipe samples collected from several contaminated surfaces (n = 5; solvent: acetone or alcohol) in the working environment of this plant gave positive mutagenic results with the tester strain TA98 in the presence of S9 mix; the extraction with acetone revealed higher mutagenic values than extraction with alcohol (Bos et al., 1984b,c).
Several genotoxicity tests performed with creosote-contaminated soils or sediments gave positive results.
The mutagenic activity (as monitored by the Ames test with Salmonella typhimurium TA98, +/– S9 mix) of a creosote/PCP waste sludge (from an active wood treatment facility) applied to soil was found to persist in surface soil at least 350 days after sludge application. During lysimeter experiments, most of the mutagenicity was detected in surface soil extracts, with weaker responses in leachate samples (Barbee et al., 1996). Similarly, the crude fraction of bottom sediment waste collected from a sediment pond of a plant using both PCP and creosote was mutagenic in the Ames assay with Salmonella typhimurium TA98 (plus S9 mix), with a total activity approximately equal to the sum of the activities of three (i.e., acid, base, neutral) fractions (Donnelly et al., 1987). A weak mutagenicity in the Salmonella Ames assay against strain TA98 (with metabolic activation) was found in the PAH fraction of soil collected from a wood treatment plant (in operation from 1924 to 1987; using 100% creosote, 50% creosote mixed with other oils and oil carrier, PCP, etc.; oil content 3–6 w/w % of soil; PAH content not quantified) and subjected to Soxhlet extraction with DCM and class component chromatographic separation (Zemanek et al., 1997).
Soil samples taken in 1996 from a former creosote wood treatment facility (in operation from 1917 to 1972) with maximum PAH concentrations of 3000 mg/kg dry soil were tested with the Ames Salmonella assay using the tester strains YG1041 and YG1042. The creosote soil extracts (extraction agent: DCM) were found to be moderately mutagenic with metabolic activation (S9 mix) and were non-mutagenic without metabolic activation. However, some bioremediation techniques resulted in an increased mutagenicity despite success in reducing the total PAH concentration, probably due to the presence of nitrogen-containing heterocycles (Brooks et al., 1998; Hughes et al., 1998).
A soil sample from a hazardous waste site contaminated with creosote (no further details) was assayed by a micronucleus test with Tradescantia. Cuttings of Tradescantia clone 4430 were exposed for 30 h to different solutions of aqueous soil extracts (initial total PAH concentration in the soil: 5749 mg/kg, weight basis not specified). The micronucleus frequencies increased in a concentration-dependent manner. A further increase in genotoxicity was seen in soil samples (containing indigenous microflora) incubated for 8 weeks, which was presumed by the authors to be due to the generation of water-soluble metabolic intermediates by the microorganisms (Baud-Grasset et al., 1993).
Sediment samples collected in 1994 near a wharf, which was treated before immersion in the water with creosote (no specification) some months before (1993), and extracted with DCM, followed with an exchange into DMSO, were tested in rainbow trout (Oncorhynchus mykiss) hepatocytes using the nick translation assay (NTA) and the alkaline precipitation assay (APA). Total PAH concentrations in these sediments ranged from 0.14 to 209 mg/kg dry weight, with the number of PAHs varying from 6 to 16. PAH concentrations and genotoxicity were higher in samples from the intertidal section than from the subtidal section. Samples closest to the wharf (1 m and 5 m) showed more genotoxicity than those farthest (40 m and 50 m) from the wharf. Whereas 80% and 60% of the intertidal samples were genotoxic according to NTA and APA, respectively, only 10% and 30% of the subtidal samples were positive in the NTA and APA, respectively. There were some correlations between levels of some PAHs (naphthalene, acenaphthylene, fluorene, phenanthrene, anthracene, and pyrene) and the NTA results, but the relevance of this finding remains unclear (Gagne et al., 1995).
A commercially available coal tar creosote (Lot No. MOP9328, manufactured by Nakarai, Kyoto, Japan) has been tested in a collaborative study using the rodent micronucleus assay. CD-1 male mice (n = 5 or more) received two intraperitoneal injections (with an interval of 24 h) of creosote (in olive oil) at a concentration of 92.5, 185, or 370 mg/kg body weight. The frequency of micronucleated polychromatic erythrocytes in bone marrow increased dose dependently and with statistical significance (24 h after final treatment). A single intraperitoneal treatment of 370 mg/kg body weight (corresponding to about 80% of the LD50) also induced micronuclei (Morita et al., 1997).
Many PAHs and some heterocyclic and other compounds occurring in creosotes have been shown to be genotoxic (Debnath et al., 1992; IPCS, 1998; Johansen et al., 1998; Heikkilä, 2001). Of 33 PAHs evaluated, only three (anthracene, fluorene, and naphthalene) were inactive in all short-term tests (IPCS, 1998; Heikkilä, 2001). With some exceptions, genotoxicity tests have given negative results for phenolic compounds (IPCS, 1994, 1995).
PCP, which is sometimes mixed with creosote, is probably not mutagenic in the Ames assay (IPCS, 1987).
The cytotoxicity and photocytotoxicity (in UV-irradiated cells) of intact (non-irradiated) and photomodified creosote (density: about 1 g/ml; Carbochem Canada) has been tested in fish cells in culture (Oncorhynchus mykiss; gill cell line RT gill-W1). Photocytotoxicity occurred at considerably lower concentrations than cytotoxicity. Photomodified creosote was found to be much more cytotoxic than intact creosote. The authors concluded from calculations with previously established toxic equivalence factors for PAHs that all the aromatic hydrocarbons present in creosote may contribute to cytotoxicity, but that photocytotoxicity was due only to the fluoranthene, pyrene, anthracene, and benz[a]anthracene in the mixture (the phototoxic BaP was not detectable in the creosote samples tested) (Schirmer et al., 1999).
Comparable in vitro tests with mammalian cells have not been performed for creosote. Cytotoxicity assays with individual PAHs in V79 Chinese hamster fibroblasts (Utesch et al., 1996) or human fibroblasts (Bauer et al., 1985) also showed (among others) a clear phototoxic potential of fluoranthene, anthracene, and benz[a]anthracene. Photolysates of BaP were found to be acutely toxic to Salmonella typhimurium TA98 (Miller et al., 1988).
Exposure of mammalian species to creosote results in enzyme induction, which can be studied and used diagnostically for the assessment of contaminant exposures, and the molecules involved can be considered prospective biomarkers of effect. Cytochrome P450 — in particular, CYP1A1, CYP2E1, and CYP3A — enzymes are induced by PAHs, benzene/toluene, and other pesticides and are involved in the metabolism of the compounds and in the formation of the reactive metabolites (see also section 6). The effect of PAH induction of CYP1A1 in the liver can be investigated by determination of EROD activity. Pentoxyresorufin-O-depentylase (PROD) is primarily due to CYP2B1. The induction of CYP1 enzymes is regulated by the aryl hydrocarbon receptor (AhR) (IPCS, 1998).
For detection of dioxin-like activity (CYP1A1 induction), liver microsomes from immature and mature mice (ICR and DDA/2) treated with creosote according to the dosage regimen described in section 7.5.1 have been examined for EROD and PROD activity. There were statistically significant and dose-dependent increases in EROD activity (with age-dependent differences) in ICR mice (e.g., immature/mature mice: 5.9-fold/11.4-fold increase at 100 mg/kg body weight). PROD activity increased in a similar way, but without age-related differences. In DBA mice, a strain less responsive to AhR ligands, enzyme induction occurred to a lesser extent (Fielden et al., 2000).
CYP1A1 induction has also been detected in fish exposed to creosote-contaminated sediments (see section 9).
There were some in vitro tests for detection of dioxin-like activity.
As seen in a gel retardation assay (using hepatic guinea-pig cytosol), coal tar creosote was able to transform the AhR to a form capable of binding a dioxin-responsive element oligonucleotide probe (Fielden et al., 2000).
An AhR-mediated receptor gene assay using Hepa 1c1c7 cells (mouse hepatoma-derived cells) showed that CYP1A1-regulated luciferase reporter gene was induced by 2,3,7,8-tetrachlorodibenzo-p-dioxin (TCDD) and creosote. The EC50 (luciferase induction) was 18 ng/litre for TCDD and 26 µg/litre for creosote. On this basis, creosote was estimated to have a relative dioxin-like potency of 0.000 731 and to contain approximately 730 mg/litre of dioxin equivalents. The authors suggested that the dioxin-like activity is likely due to the presence of dioxin-like PAHs within creosote, such as benzo[k]fluoranthene, dibenz[a,h]anthracene, chrysene, anthracene, BaP, and benz[a]anthracene (Fielden et al., 2000).
CYP1A1 induction was also seen within studies on the bioavailability of soil-bound PAHs for mammalian species. Studies with rats exposed to soil contaminated by a mixture of at least 13 PAHs showed that 1) only two or three PAHs (BaP, fluoranthene, and pyrene) were detected in liver and lung; 2) CYP1A1 activity, followed by EROD measurement, was highly induced in liver (13-fold induction) and lung (78-fold); and 3) DNA adducts were significantly increased (Fouchécourt et al., 1999). In a similar study with rats fed a diet containing contaminated soil, the highest induction of CYP1A1 was obtained with a sample containing five- and six-ring PAHs in the soil (Roos et al., 1996). A further study (Roos et al., 2002) used minipigs, which have chemical and physiological properties of the gastrointestinal tract that are similar to those of humans and, further, similar inducibility of CYP1A1 (Lu & Li, 2001). Subchronic daily oral doses of soils containing PAHs led to significant induction of CYP1A1 in several organs: liver = duodenum > lung > kidney = spleen. This induction of CYP1A1 was achieved at soil doses that are in the range of amounts ingested by playing children due to hand-to-mouth activities and is therefore suggested as a suitable model for reflecting this exposure route in humans.
The epigenetic toxicity characterized by disrupting gap junctional intercellular communication (GJIC), an effect that has been attributed to tumour promotion, has not been tested with complete creosote.
However, an artificial non-aqueous-phase liquid (NAPL) mixture of PAHs commonly found in coal tar and creosote products (toluene, naphthalene, 1-methylnaphthalene, 2-ethylnaphthalene, acenaphthene, fluorene, phenanthrene, fluoranthene, and pyrene; mole fractions: 0.03, 0.05, 0.22, 0.11, 0.11, 0.05, 0.10, 0.09, and 0.04, respectively) has been subjected to a GJIC assay (scrape loading/dye transfer assay). The cell cultures consisted of WB-F344 rat liver epithelial cell lines. GJIC was reversibly inhibited at a maximal and non-cytotoxic dose of 60 µmol/litre, with inhibition occurring within 5 min. A second mixture consisting of acenaphthene, fluoranthene, and pyrene, the three NAPL components that were not significantly degraded during biodegradation tests (NAPL mixture inoculated in batch reactors with Pseudomonas cepacia CRE7, a strain isolated from creosote-contaminated soils), showed a similar activity to that of the original NAPL mixture (Ghosal et al., 1999).
A major factor modifying the toxicity of creosote is sunlight, especially its UV components (see sections 7.4 and 7.7.1). This is due to the presence of photoabsorbing molecules (e.g., PAHs), which can be transformed by irradiation to reactive intermediates, thus leading to enhanced toxicity. Larger PAHs have been found to have a greater photoreactibility than smaller ones (Utesch et al., 1996; IPCS, 1998).
It is assumed that metabolites (diol epoxides) of PAHs play a major role in carcinogenesis, being the ultimate carcinogens (IPCS, 1998). Metabolites, especially of PAHs and heterocyclic compounds, have often been found to be more toxic than the parent compounds. For example, the 7,8-diol-9,10-epoxy metabolite of BaP was highly embryotoxic and teratogenic, whereas BaP did not cause significant increases in the incidence of malformations. Some methylated PAH metabolites were also toxic, depending on, among other factors, the position of the methyl group (IPCS, 1998).
Due to the complexity of creosote composition, the mechanism of action of creosote has not been well defined. A number of components will probably act via different mechanisms, influenced by multiple-component interactions, which may be additive, synergistic, and/or antagonistic, depending on the end-point considered and the actual composition of the mixture.
Cases of fatal poisoning (deaths in animals and humans due to multi-organ failure) after ingestion of creosote have been attributed mainly to the phenolic components in the mixture (Bowman et al., 1984).
The phototoxic action of creosote is likely due to certain PAHs and heterocycles, both, however, showing differences in photochemistry and secondary mechanisms for phototoxicity (Kochevar et al., 1982).
The mutagenic and carcinogenic properties of creosote have been predominantly attributed to certain PAHs capable of forming mutagenic DNA adducts (e.g., IARC, 1985). Mutagenicity and carcinogenicity have also been found for quinoline (IRIS, 2001).
There are also components acting via estrogen receptor- and AhR-mediated mechanisms, showing in vitro a weak potential for endocrine disruption and some kind of dioxin-like activity (Fielden et al., 2000).
All of the studies available are limited due to the lack of exposure measurements. As well, in many studies, the type of creosote is not known or is not well characterized.
Bowman et al. (1984) reported a case of intentional fatal creosote poisoning. A 70-year-old man was found unconscious after ingestion of "industrial" creosote (probably about 1 litre). After about 30 h, the patient became acidotic and anuric and died. An obvious extensive ulceration of the oropharynx could be seen. Postmortem examination showed petechial haemorrhages over the intestinal surfaces and over the pericardium. The oesophageal and gastric mucosa were stained brown but showed no ulceration. An acute tubular necrosis in the kidney and some degeneration and necrosis of the liver were noted.
According to Lewin (1929), deaths have occurred 14–36 h after the ingestion of about 7 g of creosote by adults or 1–2 g by children. Symptoms included salivation, vomiting, respiratory difficulties, thready pulse, vertigo, headache, loss of pupillary reflexes, hypothermia, cyanosis, and mild convulsions.
Physicians in California, USA, reported 10 cases (systemic: 2, eye: 1, skin: 5, eye/skin: 2) of illness or injury due to creosote to the register of the California pesticide illness surveillance programme in 1987 (Maddy et al., 1990). Data on pesticide poisoning have also been collected for England and Wales. Creosote was responsible for 27 out of 1012 (2.7%) pesticide deaths occurring between 1945 and 1989. At least 73% of all pesticide fatalities were due to suicide (Casey & Vale, 1994). Creosote was also involved in accidental pesticide poisoning in children (less than 10 years old). In a United Kingdom survey (United Kingdom Home Accident Surveillance System, 1989–1991), 17 (7%) out of 250 paediatric pesticide poisoning cases were due to creosote. Eight of these children with suspected creosote poisoning were admitted to hospital; none died (Thompson et al., 1994).
In 1990, a 2-year health surveillance project began on residents (African American, 123 males, 91 females) living in or near an abandoned creosote wood treatment plant in Texas, USA. The most obvious health effects determined by self-reported interview referred to dermal effects. During the first year of the surveillance, the prevalence of skin rashes was higher than in the control group (African Americans from a nearby town, 122 males, 93 females) — namely, 27.9% versus 4.9%, with a relative risk (RR) of 5.72 (95% confidence interval [CI] = 3.0–10.9). In the second year, the results were confirmed. Results of the first year showed a statistically significant excess of chronic bronchitis (RR = 2.65; 95% CI = 1.26–5.57), which was reduced and not statistically significant (11 observed vs. 7 expected) in the second year. The authors underline that reliance on self-reported information seriously limits the interpretation of the study (ATSDR, 2002).
In the USA, an excess incidence of breast and gastrointestinal cancers among women was observed in a community (St. Louis Park, Minneapolis, Minnesota) exposed to low levels of creosote components in municipal water. Apparently, the groundwater reservoirs became contaminated by deposited wastes from a plant that distilled coal tar products and treated wood from 1917 to 1972 (Dusich et al., 1980). However, a reanalysis attributed the difference to the confounding effect of other risk factors for breast cancer, such as age at first birth, parity, age at menarche and menopause, body mass index, history of benign breast disease, and family history (Dean et al., 1988). In conclusion, a clear connection could not be demonstrated between breast cancer and coal tar creosote-contaminated water, nor was the increased incidence of gastrointestinal cancer more than slightly significant (ATSDR, 2002).
Health data on children in contact with creosote via wooden creosoted playing equipment have not been reported. Effects mediated via parental exposure have been investigated in three studies (Savitz et al., 1989; Feingold et al., 1992; Kerr et al., 2000). Positive associations have been found for childhood brain cancer (Feingold et al., 1992; odds ratio [OR] = 3.7, 95% CI = 0.8–16.6; see also Table 31) and childhood neuroblastoma (Kerr et al., 2000; OR = 2.1, 95% CI = 1.1–4.3; see also Table 31). Another study evaluated the relation between potential paternal exposure and small-for-gestational-age infants (40 exposed cases; 371 total cases); the resulting risk elevation (odds ratio, adjusted for several factors) was 1.1 (95% CI = 0.7–1.7) (Savitz et al., 1989).
Table 31: Summary of occupational case–control studies on creosote and cancer.a
|
Study population |
Exposed cases/ referents |
Adjusted OR |
95% CIb |
Reference, notes |
|
Hodgkin disease |
||||
|
54 cases, both females and males, from a hospital registry, diagnosed in Örebro, Sweden, 1964–1986; and 275 referents of similar age from the same area from population registries |
2/1 |
10.7 |
1.1–103* |
Persson et al. (1989); 90% CI; OR adjusted for age at time of diagnosis, sex, farming, exposure to fresh wood, and exposures associated with at least doubled risk for Hodgkin disease. |
|
31 cases, both females and males, from the Cancer Registry, diagnosed in Linköping, Sweden, 1975–1984; and 204 referents of similar age from the same area from population registries |
0/4 |
0 |
0–10.3* |
Persson et al. (1993); CI estimated by the Consultative Group and is unadjusted. OR adjusted for age at time of diagnosis and exposures associated with at least doubled risk for Hodgkin disease. |
|
Non-Hodgkin lymphoma |
||||
|
106 cases, both females and males, from a hospital registry, diagnosed in Örebro, Sweden, 1964–1986; and 275 referents of similar age from the same area from population registries |
5/1 |
9.4 |
1.2–69* |
Persson et al. (1989); 90% CI; OR adjusted for age at time of diagnosis, sex, farming, exposure to fresh wood, and exposures associated with at least doubled risk for non-Hodgkin lymphoma. |
|
93 male cases from the Cancer Registry, diagnosed in Linköping, Sweden, 1975–1984; and 204 referents of similar age from the same area from population registries |
0/44 |
0 |
0–3.4 |
Persson et al. (1993); CI estimated by the Consultative Group and is unadjusted; OR adjusted for age at time of diagnosis and exposures associated with at least doubled risk for non-Hodgkin lymphoma. |
|
622 cases from rural Minnesota and Iowa diagnosed in 1980–1983 and 1245 frequency-matched (state, age, year of death for the deceased cases) referents by random digit dialling (<65 years of age) or from Medicare files (>65 years of age) for those alive and from state vital records for the deceased |
Exposed to asphalt and/or creosote |
Blair et al. (1993); OR adjusted for age, state, smoking, family history of malignant lymphoproliferative disease, agricultural exposure to pesticides, use of hair dyes, and direct/surrogate respondent; a large number of comparisons made; exposure to asphalt and creosote not differentiated. |
||
|
53/105 |
1.0 |
0.7–1.5 |
||
|
Low-intensity exposure |
||||
|
49/97 |
1.0 |
0.7–1.5 |
||
|
High-intensity exposure |
||||
|
4/8 |
1.1 |
0.3–4.0 |
||
|
Multiple myeloma |
||||
|
131 cases, both females and males, from several hospital registries, diagnosed in Linköping, Sweden, 1972–1983, and alive in 1981–1983; and 484 random referents from population registries from the same geographical area |
7/4 |
4.7 |
1.2–18.0 |
Flodin et al. (1987); OR adjusted for multivariate confounder score. |
|
Glioma |
||||
|
125 male cases from a neurological hospital, France, diagnosed in 1975–1984, age <65 years, and 238 male referents of the same age group with a vascular, non-neoplastic, non-malformative neurological disease |
Wood workers |
Cordier et al. (1988); CI calculated by the Consultative Group. |
||
|
9/11 |
1.6 |
0.6–4.2 |
||
|
Glioma (contd) |
Creosote exposure in woodworkers |
|
||
|
- possible or certain |
|
||
|
6/7 |
1.1 |
0.1–11.1 |
||
|
- certain |
||||
|
5/3 |
1.7 |
0.1–23.4 |
|
|
- >30% of time |
||||
|
1/0 |
undefined |
|||
|
Urinary bladder |
||||
|
484 male cases, 35–70 years of age, with pathologically confirmed diagnosis between 1979 and 1986, in Montreal, Canada, and 1879 referents from the same hospitals with another malignant disease, plus 533 healthy population referents from electoral lists and random digit dialling |
Non-substantial exposure |
Siemiatycki et al. (1994); adjusted for age, ethnicity, socioeconomic status, smoking, coffee, respondent status, other substances. |
||
|
6/n.sp.C |
1.1 |
0.4–2.9 |
||
|
Substantial exposure |
||||
|
1/n.sp. |
0.4 |
0.1–3.3 |
||
|
Lung cancer |
||||
|
310 cases from among the male staff of the national electricity and gas company in France, diagnosed in 1978–1989, and 4 referents for each from company records |
114/50 |
1.6 |
1.1–2.3 |
Martin et al. (2000); OR and CI adjusted for socioeconomic status and for exposure to asbestos; OR increased with cumulative exposure (1.0, 1.8, 1.2, 1.2, and 2.4 for no exposure and four exposure categories). |
|
Oral cancer |
||||
|
410 cases diagnosed in 1980–1989 from four counties in Sweden from the cancer registry, and an age-, county-, and sex- (and for the deceased, year of death) matched referent for each case from the population registry |
3/6 |
0.5 |
0.1–2.0 |
Schildt et al. (1999); exposure assessment during 1 year before the diagnosis from mailed questionnaire; unadjusted figures. |
|
Childhood cancer (0–14 years) |
||||
|
341 cases of childhood cancer (including 67 brain cancers) diagnosed in 1976–1983 in Denver, USA, from Colorado Central Cancer Registry and 222 age-, sex-, and telephone exchange area-matched controls from random digit dialling |
Paternal exposure to creosote |
Feingold et al. (1992); OR and CI adjusted for father’s education; exposure (according to job exposure matrix) during the year prior to the child’s birth. |
||
|
Brain cancer |
||||
|
5/5 |
3.7 |
0.8–16.6 |
||
|
Total childhood cancer |
||||
|
15/5 |
2.5 |
0.8–8.1 |
||
|
183 histologically confirmed cases of neuroblastoma from New York state, excluding New York City, between 1976 and 1987 from New York State Cancer Registry and 372 referents from birth certificate registry, frequency matched for year of birth |
Paternal exposure to creosote |
Kerr et al. (2000); OR and CI adjusted for several sociodemographic variables, including age at child’s birth, education, and nativity; exposure from telephone interview of the mother. |
||
|
Neuroblastoma |
||||
|
21/21 |
2.1 |
1.1–4.3 |
||
|
a |
In all studies, exposure to creosote is estimated, not measured. |
|
b |
An asterisk (*) indicates a 90% CI. |
|
c |
n.sp. = not specified. |
Occupational exposure to creosote, creosote vapour, or creosote dust can elicit mild to severe irritation or lesions of the skin, such as erythema, dermatitis, hyperpigmentation, or warts (Hudelo et al., 1927; Schwartz, 1942; Jonas, 1943; Merlescu, 1974; Markel et al., 1977; Flickinger & Lawrence, 1982; Heyl & Mellet, 1982; Willeitner & Dieter, 1984; Edmiston & Maddy, 1987), and eyes (Birdwood, 1938; Jonas, 1943; Markel et al., 1977; Edmiston & Maddy, 1987), as well as benign skin lesions (Mackenzie, 1898; Haldin-Davis, 1935). Phototoxic/photoallergic reactions, which can be induced by additional exposure to UV light (sun), have also been observed (Jonas, 1943; Merlescu, 1974; Heyl & Mellet, 1982). Conjunctiva and cornea are the parts of the eye affected. Contact of liquid creosote with the eye has caused painful protracted keratoconjunctivitis (Grant & Schuman, 1993).
General symptoms, such as depression, weakness, severe headache, slight confusion, vertigo, nausea, and increased salivation, have been documented in 11 out of 450 (2.4%) construction workers with creosote burns (Jonas, 1943). Of 120 workers who had sprayed warmed creosote (air concentration up to 10 mg/m3), 113 complained of headache, giddiness, nausea, vomiting, and/or copious salivation (Dumler, 1962).
Women (281 cases, 216 controls, USA) occupationally exposed to dusts that were primarily wood- and agriculture-related were found to have an increased risk of infertility (OR = 2.87, CI = 1.05–7.88); however, there were no data available to establish an association with the wood preservatives (PCP, creosote, formaldehyde, chromium, or arsenic) commonly used (Smith et al., 1997).
There are several case reports and series (Mackenzie, 1898; O’Donovan, 1920; Cookson, 1924; Henry, 1947; Lenson, 1956) on skin cancer (epitheliomata of the head, neck, lip, hands, legs, or scrotum) in workers exposed to creosote for decades. Metastases to inner organs have also been reported (Cookson, 1924).
A number of case–control studies exploring the association between different types of cancer and creosote exposure have been conducted. A statistically significant association for multiple myeloma was reported in one study (Table 31; Flodin et al., 1987), in one of two studies on Hodgkin disease (Persson et al., 1989, 1993), in one of three studies on non-Hodgkin lymphoma (Persson et al., 1989, 1993; Blair et al., 1993), and in one study on lung cancer (Martin et al., 2000). No association was found for bladder cancer (Siemiatycki et al., 1994) or squamous cell oral cancer (Schildt et al., 1999). An association was observed between potential paternal ocupational exposure to creosote and brain cancer and neuroblastoma in children (Feingold et al., 1992; Kerr et al., 2000).
Several cohort and record linkage studies have analysed cancer incidence or mortality among creosote-exposed workers (Axelson & Kling, 1983; Törnqvist et al., 1986; Steineck et al., 1989; Karlehagen et al., 1992; Pukkala, 1995; see also Table 32). Henry (1946) calculated that the crude mortality rate for scrotal cancer during 1911–1939 for brickmakers (exposed to creosote oil), based on nine cases, was 29 × 10–6, while that for the general population was 4.2 × 10⁻⁶. Excess risks were observed for other occupations with exposure to creosote, but with smaller numbers of cases. In a small cohort study (reported as an abstract only) of wood impregnators exposed to creosote and arsenic, eight cases of cancer at different sites were observed, while six were expected from national figures; in a subgroup of workers not exposed to arsenic, three cancer cases were observed (0.8 expected) (Axelson & Kling, 1983). In a cohort study (Karlehagen et al., 1992) examining 922 Swedish and Norwegian wood impregnators (e.g., railroad cross ties and telegraph poles; no data on individual exposure available) from 13 plants found a standardized incidence ratio (SIR) of 250 for lip cancers and an SIR of 237 for (non-melanoma) skin cancer. The risk increased with the latency; analysis by duration of exposure was not provided. According to the authors, the significantly elevated risk for lip and skin cancer could probably be attributed to the combination of exposure to creosote and sunlight (Karlehagen et al., 1992). In a population-based record linkage study in Finland, elevated risks for lip cancer (SIR = 306) and non-melanoma skin cancer (SIR = 464) were found for round-timber workers (Pukkala, 1995); according to Heikkilä (2001), the round-timber workers can be classified as being exposed to creosote. Statistically non-significant slight increases were observed for the cancers of the skin and nervous system, but not of the lung, among power linesmen in a Swedish record linkage study (Törnqvist et al., 1986). A statistically non-significant, slight increase in the incidence of cancer of the urinary tract was also observed in this study. In a registry linkage study (Steineck et al., 1989), borderline statistically significant increased risks of bladder and renal pelvic cancer incidence were observed among telephone and telegraph lineworkers.
Table 32: Summary of cohort and registry linkage studies on creosote and cancer.a
|
Study design and population |
Cancer siteb |
Observed number of cases |
Expected number of cases |
Risk metricc |
95% CId |
Reference, notes |
|
A cohort of 123 Swedish workers applying creosote to wood, 1950–1980. Cancer mortality reported. |
All exposed |
Axelson & Kling (1983); abstract only; exposure also to arsenic; statistical significance not indicated, apparently not significant. |
||||
|
All cancer |
8 |
6 |
||||
|
Exposure to creosote only, for >5 years |
||||||
|
All cancer |
3 |
0.8 |
||||
|
All incident cases of cancer in males from the Swedish Cancer Registry in 1961–1979 linked to Census information on job in 1960. SIR calculated for power linesmen in electric power industry using 5-year age and county stratification. |
All sites |
236 |
SIR: 110 |
100–120* |
Törnqvist et al. (1986); exposure to electrical and magnetic fields, creosote, lead, isocyanates, silicon. |
|
|
Lung, trachea |
17 |
SIR: 70 |
40–100* |
|||
|
Urinary organs excluding kidney |
18 |
SIR: 120 |
80–180* |
|||
|
Skin (non-melanoma) |
8 |
SIR: 150 |
70–260* |
|||
|
Nervous system |
13 |
SIR: 150 |
90–240* |
|||
|
All incident cases of urothelial cancer in males from the Swedish Cancer Registry in 1961–1979 linked to Census information on job in 1960. Job exposure matrix used to characterize the exposures; rate ratios (RR) calculated between the exposed and those not exposed to any chemical. |
Creosote exposed (line workers in electric power stations and telephone and telegraph companies) |
Steineck et al. (1989); adjusted for age, socioeconomic group, degree of urbanization; overlap with Törnqvist et al. (1986) possible. |
||||
|
Renal pelvic cancer |
6 |
RR: 213 |
94–480 |
|||
|
Bladder cancer |
48 |
RR: 135 |
101–179 |
|||
|
Cohort of 922 men employed >1 year in 1950–1980 in 13 wood impregnation plants in Sweden and Norway followed from cancer registries from August 1953 to May 1987 or through 79 years of age. |
All sites |
129 |
SIR: 94 |
78–110 |
Karlehagen et al. (1992); exposure assessment through questionnaire to the plants; for cancer of lip and skin, increase in risk by latency. |
|
|
Lip |
5 |
SIR: 250 |
81–583 |
|||
|
Lung |
13 |
SIR: 79 |
42–135 |
|||
|
Urinary bladder |
10 |
SIR: 111 |
53–204 |
|||
|
Skin (non-melanoma) |
9 |
SIR: 237 |
108–450 |
|||
|
Melanoma |
5 |
SIR: 172 |
56–401 |
|||
|
Malignant lymphoma |
8 |
SIR: 190 |
83–378 |
|||
|
- Hodgkin disease |
2 |
SIR: 200 |
24–723 |
|||
|
- non-Hodgkin lymphoma |
6 |
SIR: 189 |
69–412 |
|||
|
All incident cases of cancer from the Finnish Cancer Registry in 1971–1985 linked to Census information on occupation in 1970. Person-years at risk calculated from yearly death registers. Sex-, age-, and period-specific SIRs calculated for each exposed group. Figures given for round-timber workers, which includes impregnation workers and workers handling preserved timber, and timber workers, which includes impregnation workers (Heikkilä, 2001). |
Round-timber workers |
Pukkala (1995); figures adjusted for social class; figure not given if the expected cases were less than 5 and the SIR was not significantly different from 1; most impregnation workers are also exposed to other impregnation products. |
||||
|
All sites |
86 |
SIR: 128 |
103–158 |
|||
|
Lip |
5 |
SIR: 306 |
99–713 |
|||
|
Lung |
26 |
SIR: 118 |
77–173 |
|||
|
Ureter, bladder, urethra |
n.d.e |
|||||
|
Skin (non-melanoma) |
5 |
SIR: 464 |
151–1080 |
|||
|
Skin melanoma |
n.d. |
|||||
|
Non-Hodgkin lymphoma |
n.d. |
|||||
|
Timber workers |
||||||
|
All sites |
344 |
SIR: 93 |
84–103 |
|||
|
Lip |
19 |
SIR: 215 |
129–335 |
|||
|
Lung |
88 |
SIR: 73 |
59–90 |
|||
|
Ureter, bladder, urethra |
15 |
SIR: 91 |
51–151 |
|||
|
Skin (non-melanoma) |
3 |
SIR: 51 |
10–148 |
|||
|
Skin melanoma |
11 |
SIR: 124 |
62–222 |
|||
|
Non-Hodgkin lymphoma |
6 |
SIR: 83 |
30–180 |
|||
|
a |
All studies performed without exposure measurements. |
|
b |
Cancer sites reported for which there was an increased risk or for which the studies on individual sites had indicated an elevated risk. |
|
c |
RR = rate ratio; SIR = standardized incidence ratio. |
|
d |
An asterisk (*) indicates a 90% CI. |
|
e |
n.d. = not determined. |
All of the studies available are limited due to the lack of exposure measurements. Furthermore, in many of the studies, the type of creosote is not known or not well characterized. Other limitations include the small number of cases and the possible influence of occupational or non-occupational confounding factors (e.g., multiple exposures). Taking all results together, the most frequent and consistent associations have been found for skin cancer. No consistent support was observed in the cohort and record linkage studies for the association between creosote exposure and cancer of the lung, urinary tract, or lymphoma reported in some of the case–referent studies.
The toxicity of five Swedish creosote products in acetone and aqueous solutions to bacteria has been tested in the Microtox bioassay (inhibition of bioluminescence from Photobacterium phosphoreum or Vibrio fischeri) (Sundström et al., 1986). The 15-min EC50 values were in the range of 0.38–0.63 mg/litre (acetone solutions).
A toxic response to creosote-contaminated surface waters (Pensacola Bay, Florida, USA; Middaugh et al., 1991), groundwaters (Middaugh et al., 1991, 1994b; Mueller et al., 1991a), and sediments has been measured using the Microtox bioassay. Microtox tests of acetone extracts of two creosote-polluted sediments from Sweden and Norway resulted in a toxicity comparable to that of the original creosote (see above), with 15-min EC50 values of 0.27–0.88 mg/litre (Sundström et al., 1986).
Significant decreases in luminescence have also been observed in Microtox tests of pore waters and/or elutriates of creosote-contaminated river (Pastorok et al., 1994) or lake (Hyötyläinen & Oikari, 1999a,b) sediment samples. The greatest effects were found for samples from a dock used for creosote off-loading (Pastorok et al., 1994) or from sites with the highest total PAH concentration (3.3 mg/g dry weight; EC50 of a 1:2 elutriate = 4.5%; Hyötyläinen & Oikari, 1999a,b), respectively. Sediment elutriate samples from a creek adjacent to a wood treatment site showed EC50 values ranging from 4 to 30% in the Microtox bioassay (Athey et al., 1989).
A strong inhibition of nitrification by creosote-contaminated water has been observed during a laboratory leaching experiment (sand column artificially contaminated with creosote) combined with a nitrification toxicity bioassay. There were good correlations between toxicity and concentrations of five selected creosote compounds (benzene, toluene, o-xylene, phenol, and o-cresol) in the leachate. Most of the toxicity was associated with the two phenolic compounds. Pseudocritical concentrations (defined as the concentration of a toxicant for which a 100% inhibition of nitrification was expected) were determined for four of the five compounds: 10.7 mg/litre for benzene, 8.4 mg/litre for o-xylene, 3.5 mg/litre for phenol, and 1.3 mg/litre for o-cresol (Dyreborg & Arvin, 1995). Several organosulfur compounds, some of which occur in creosote, were found to have inhibitory effects on anaerobic microbial metabolism (lactate degradation, nitrate or sulfate reduction, and methanogenesis) (Londry & Suflita, 1998).
A small aquatic vascular plant (Spirodela polyrrhiza) has been tested with water-soluble fractions (WSFs) of coal tar distillates. The 5% and 10% WSFs (PAH content not determined) caused a 95% and 100% inhibition in growth (determined by the number of fronds), respectively, after 10 days of incubation (King & Coley, 1984).
A culture of the aquatic macrophyte Myriophyllum spicatum was exposed to creosote concentrations ranging from 0.16 to 200 mg/litre for 2 weeks (17 nominal creosote concentrations plus 3 controls; creosote from Stella-Jones, New Westminster, British Columbia, Canada). Concentrations of up to 13.3 mg/litre stimulated shoot growth but inhibited root growth (as measured by length). At higher concentrations, shoot growth was also inhibited. A biphasic response was also observed for biomass (dry weight), with inhibition occurring at concentrations above 3.6 mg/litre. Root number (due to adventitious roots being produced along the length of the stem and not only at the base of the plant) was significantly higher at 3.6 mg/litre, and root length was significantly reduced at 4.5 mg/litre. Visual changes, including an increase in pink coloration and changes in the location of root initiation, could be observed at nominal creosote concentrations as low as 1.5 mg/litre (1 mg creosote/litre treatment corresponded to about 170 µg total PAHs/litre). The EC50 values (decrease) for the three parameters shoot length, node production, and dry weight were calculated to be 55.1 mg/litre, 86 mg/litre, and 33.4 mg/litre, respectively. Altogether, creosote induced signs of stress and abnormal growth in the exposed plants (McCann et al., 2000). In addition to the growth bioassay, effects of creosote on membrane permeability were tested in Myriophyllum spicatum at nominal concentrations ranging from 0.1 to 92 mg creosote/litre (the lowest creosote treatment corresponded to approximately 8.8 µg total PAHs/litre in the growth medium). Apical meristems from axenic Myriophyllum plants were exposed to these concentrations (eight treatments, three controls) for 4 days, after which membrane integrity was determined by tissue conductivity measurements. Results indicated a significant, dose-dependent increase in ion leakage at all concentrations tested (McCann & Solomon, 2000). Marwood et al. (2001) reported a 12-day EC50 of 2.6 mg total PAHs/litre (nominal concentration) for growth inhibition of Myriophyllum spicatum from a static renewal test under simulated solar radiation (SSR, which mimics the relative levels of UV radiation found in natural sunlight generated by cool-white fluorescent bulbs plus 300-nm and 350-nm photoreactor lamps, altogether producing visible light plus UV-A and UV-B). Growth measurements were based on the increase in fronds during the exposure to marine-grade liquid creosote (Stella Jones, New Westminster, British Columbia, Canada).
When a culture of the floating aquatic macrophyte Lemna gibba (duckweed; n = 32) was exposed to liquid creosote (Stella-Jones, Vancouver, British Columbia, Canada) in static renewal 8-day toxicity bioassays under visible light (generated by cool-white fluorescent bulbs), an EC50 value of 49.7 µl/litre (nominal concentration) was obtained for reduction in growth rate (as measured by increase in leaf number); this corresponds to 54.2 mg/litre (density of this creosote: 1.09 g/ml). A marked increase in toxicity was observed following irradiation of the plants (n = 28) with SSR. The resulting EC50 value was 10.7 µl/litre (equivalent to 11.7 mg/litre), thus exhibiting a 5-fold decrease compared with visible light. Comparable EC50 values were found for chlorophyll content and photosynthetic end-points (Gensemer et al., 1996). This phototoxicity is consistent with findings in Lemna gibba exposed to PAHs under SSR (Huang et al., 1993; Ren et al., 1994). Marwood et al. (2001) reported an 8-day EC50 of 7.2 mg total PAHs/litre (nominal concentration) for growth inhibition of Lemna gibba from a static renewal test under SSR. Growth measurements were based on shoot length and number of leaf nodes during exposure to marine-grade liquid creosote (Stella Jones, New Westminster, British Columbia, Canada).
Data on the acute toxicity of various creosotes to aquatic invertebrates have been compiled in Table 33. For molluscs, a 96-h EC50 (reduction of shell deposition in eastern oyster, Crassostrea virginica) value of 0.7 mg/litre has been determined (Borthwick & Patrick, 1982). EC50/LC50 values reported for crustaceans ranged from 0.018 mg/litre (mysid shrimp, Mysidopsis bahia; Borthwick & Patrick, 1982) to 4.3 mg/litre (water flea, Daphnia magna; IUCLID, 1995). Larval stages of lobster (Homarus americanus) proved to be more sensitive than adult stages, with 96-h EC50 values of 0.02 vs. 1.8 mg/litre (McLeese & Metcalfe, 1979). Two different creosote products tested in Daphnia magna resulted in different 48-h EC50 values (immobilization): i.e., 1.0 and 4.3 mg/litre (IUCLID, 1995).
Table 33: Acute toxicity of creosote to aquatic invertebrates.a
|
Species |
Life stage |
Creosote type (solvent used) |
Test type / conditions |
End-point (effect) |
Concentrationb (mg/litre) |
Reference |
|
Eastern oyster |
36 mm |
Marine-grade |
Flow / 21.4 °C; 21.1% salinity |
96-h EC50 (reduction of shell deposition) |
0.71 n |
Borthwick & Patrick (1982) |
|
Water flea |
n.sp. |
Creosote PTT |
stat / (OECD Guideline 202) |
48-h EC50 |
4.3 n |
IUCLID (1995) |
|
Copepod |
n.sp. |
Swedish creosote products, 1984, n = 5 |
n.sp. / n.sp. |
96-h LC50 |
0.76–1.56 n |
Sundström et al. (1986) |
|
Mysid shrimp |
1 mm |
Marine-grade |
stat / 25.5 °C; 20.0% salinity |
96-h LC50 |
0.018 n |
Borthwick & Patrick (1982) |
|
Pink shrimp |
83 mm |
Marine-grade |
flow / 24.2 °C; 21.0% salinity |
96-h LC50 |
0.24 n |
Borthwick & Patrick (1982) |
|
Lobster |
Larval |
n.sp. (n.sp.) |
semi-stat / 20 °C; 30% salinity |
96-h LC50 |
0.02 m |
McLeese & Metcalfe (1979) |
|
Marine sand shrimp (Crangon septemspinosa) |
Adult, 1.3 g |
n.sp. (n.sp.) |
semi-stat / |
|
|
McLeese & Metcalfe (1979) |
|
a |
Abbreviations used: EC50 = median effective concentration; flow = flow-through conditions; LC50 = median lethal concentration; m = based on measured concentrations; n = based on nominal concentrations; NOEL = no-observed-effect level; n.sp. = not specified; OECD = Organisation for Economic Co-operation and Development; semi-stat = semistatic conditions (renewal at 48-h intervals); stat = static conditions; TEG = triethylene glycol. |
|
b |
95% confidence intervals in parentheses. |
Lifetime exposure (about 90 days) of Daphnia pulex to WSFs of creosote (Ace Hardware; at concentrations of 1 and 1.8% WSFs) led to a decrease in growth rates and reproductive impairment, such as reduced number of broods, disturbances in moulting, and an increase in abortion rates (Geiger & Buikema, 1982).
Sediments collected from various sites (estuarine and coastal waters, streams, lakes) polluted predominantly with creosote have also been demonstrated to be toxic against aquatic molluscs, including, for example, oysters (Chu & Hale, 1994), crustaceans (Sundström et al., 1986; Swartz et al., 1989; Sasson-Brickson & Burton, 1991; Pastorok et al., 1994; Padma et al., 1998, 1999; Hyötyläinen & Oikari, 1999a,b), and other invertebrates (Metcalfe & Hayton, 1989).
The Elizabeth River (Virginia, USA) is known as a highly contaminated subestuary of the Chesapeake Bay, some parts of which have been impacted by creosote spills as well as by creosote plants, petroleum tank farms, and wet and dry docks (Bieri et al., 1986). A wood treatment facility used creosote from the 1950s until 1992, contributing significantly to pollution in its vicinity (Padma et al., 1999). According to Huggett et al. (1992), sediment concentrations of creosote-related aromatic organic compounds were as high as 15 g/kg dry weight. Futhermore, they noted that areal distribution of the contaminants in the river and biological responses reported seem to be best correlated with the concentration of the creosote compounds (Huggett et al., 1992).
An increase in susceptibility to infectious disease has been demonstrated in eastern oysters (Crassostrea virginica) exposed to 0, 15, and 30% dilutions of the WSF generated from Elizabeth River sediments. The mean total PAH concentration in this sediment was 2.4 g/kg dry weight. The mean concentration of aromatic compounds in the WSF (more than 100 compounds) was 4.08 mg/litre, with naphthalene, acenaphthene, 2-methylnaphthalene, phenanthrene, fluorene, dibenzofuran, 1-methylnaphthalene, and carbazole being the predominant compounds (concentrations ranging from 0.15 to 1.51 mg/litre). Exposure to these fractions for 56 or 68 days enhanced pre-existing infections caused by the protozoan parasite Perkinsus marinus (Dermo) and increased the oysters’ susceptibility to experimentally induced infection in a dose-dependent manner (Chu & Hale, 1994).
Of crustaceans, the epibenthic bay mysid Mysidopsis bahia has been tested for acute (Padma et al., 1998) and sublethal (Padma et al., 1999) effects after exposure to creosote-contaminated sediment of the Elizabeth River (collected near wood treatment industry). The 48-h LC50 values (nominal concentrations; semistatic conditions) was given as 0.7 mg/litre total identified aromatic organic compounds for the WSF of the sediment. Compared with the 96-h LC50 value of 0.018 mg total identified aromatic organic compounds/litre obtained with the WSF of whole creosote (see Table 33), the sediment WSF was less acutely toxic. Chemical analyses showed major differences in the composition of the two WSFs, the most striking being an enrichment of the creosote WSF with nitrogen-containing heterocycles (>80%; low-molecular-weight aromatic organic compounds), which were not detected in the sediment WSF. The latter had higher proportions of PAHs. The authors suggested that the higher toxicity of the whole creosote WSF is due at least in part to the presence of the nitrogen-containing heterocycles (Padma et al., 1998). Exposure of Mysidopsis bahia to sublethal concentrations of WSF sediments from the same site for 7 days resulted in a significant decrease in dry weight gain and in proportion of gravid females. The EC50 was 0.015 µg total identified aromatic organic compounds/litre, corresponding to 1% WSF (Padma et al., 1999).
Another location contaminated by a mixture of PAHs characterisitic of creosote is Eagle Harbor (Washington, USA). The total concentration of 13 PAHs in the sediment tested was 6461 mg/kg dry weight. Exposure of the amphipod Rhepoxynius abronius to this sediment and to its interstitial water caused complete acute mortality. All amphipods (n = 20) exposed to beds of undiluted sediment died within 10–60 min. In dilution experiments with uncontaminated sediment from Yaquina Bay (Oregon, USA), the 4-day LC50 was 666 mg/kg wet weight (Swartz et al., 1989).
River sediments collected (1980–1992) in the vicinity of a wood treatment (creosote) facility (Oregon, USA) were tested for mortality of the amphipod Hyalella azteca (10-day static bioassay; according to the American Society for Testing and Materials). Of the 48 stations tested, 7 had sediments that were significantly (P < 0.05) toxic relative to local reference area sediments, and 6 were significantly (P < 0.05) toxic relative to other reference (Wilsonville) sediments. The highest mortalities (31–100%) were found in the area of the creosote dock, the adjacent shoreline upstream of the creosote dock, and the railroad bridge. Beside PAHs as main contaminants, other groups of potentially toxic chemicals, such as chlorinated phenols, PCDDs/PCDFs, and arsenic, have been identified in the sediments to a limited extent (concentrations not reported) (Pastorok et al., 1994).
Sediments from another river (Ohio, USA) impacted by several contaminants including creosote were found to significantly reduce survival rates of Ceriodaphnia dubia after static 48-h laboratory exposures (0–42% survival rates versus 93–100% in controls from an upstream reference site, n = 7 tests). Identified contaminants of downstream polluted sediments consisted of 14 PAHs (15–213 mg/kg dry weight) and several metals, such as chromium, cadmium, copper, lead, and zinc (Sasson-Brickson & Burton, 1991).
Parts of the bottom sediments collected from a lake in Finland (Lake Jämsänvesi) have been contaminated by a creosote impregnation plant, which was in operation for 20 years until 1976. Elutriates of several sediment samples (sediment/water 1:4, v/v) collected from 16 sites in the 1990s were acutely toxic to Daphnia magna (Hyötyläinen & Oikari, 1999a,b). The most toxic sample (from site 13; 0–10 cm depth) gave a 24-h EC50 value (immobilization test) of 21% (± 1.0%) (elutriate equals 100%) and was associated with a total PAH concentration of 1421 µg/litre and a BaP concentration of 1680 ng/litre (Hyötyläinen & Oikari, 1999b). The corresponding total PAH sediment concentration was 3294 mg/kg dry weight. The elutriates were non-toxic when their total PAH concentrations remained below 0.7 µg/litre. The reference sediment from another lake (Lake Palosjärvi) did not contain PAHs (detection limit 0.5 µg/kg dry weight) and was not toxic in the Daphnia tests (Hyötyläinen & Oikari, 1999a).
Acetone extracts from Swedish and Norwegian sediments (ecosystem not specified) contaminated by creosote about 10–20 years ago were also highly toxic to Nitocra spinipes (crustacean). The 96-h LC50 values of 0.51 (95% CI = 0.42–0.57) and 0.55 (95% CI = 0.42–0.72) mg/litre (based on extractable organic matter), respectively, were in a similar order of magnitude as those of pure creosote (see Table 33), although not all extracted material could be redissolved in acetone (Sundström et al., 1986).
Sediments collected near a wood-preserving plant on Thunder Bay Harbour, Canada, and highly contaminated by creosote (oil and grease content: 7600–80 000 mg/kg), PCP, metals, and other toxicants were found to be acutely toxic to mayflies (Hexagonia limbata) and leeches (Nephelopsis obscura) during a 10-day laboratory exposure study (Metcalfe & Hayton, 1989).
The acute toxicity of several creosote preparations to vertebrates has been studied in several species of fish in Pensacola, Florida, USA (Webb, 1975; Borthwick & Patrick, 1982; Sundström et al., 1986; IUCLID, 1995) (see Table 34). LC50 values ranged from 0.72 mg/litre (Borthwick & Patrick, 1982) to 10.5 mg/litre (Sundström et al., 1986). Sheepshead minnows (Cyprinodon variegatus) had a 96-h LC50 of 0.72 mg/litre in static water and 3.5 mg/litre in flowing water (Borthwick & Patrick, 1982).
Table 34: Acute toxicity of creosote to aquatic vertebrates.a
|
Species |
Life stage |
Creosote type (solvent used) |
Test type / conditions |
End-point (effect) |
Concentrationb (mg/litre) |
Reference |
|
Rainbow trout |
58 mm |
Marine-grade P 13 (acetone) |
stat / (APHA/ ORSANCO test methods) |
24-h LC50 |
2.16 n |
Webb (1975) |
|
Rainbow trout |
58 mm |
Creosote/coal tar mixture (60/40) (acetone) |
stat |
24-h LC50 |
4.42 n |
Webb (1975) |
|
Goldfish (Carassius auratus) |
37–63 mm |
Marine-grade P 13 (acetone) |
stat |
24-h LC50 |
3.51 n |
Webb (1975) |
|
Bluegill sunfish |
42 mm |
Creosote/coal tar mixture (60/40) (acetone) |
stat |
24-h LC50 |
3.72 n |
Webb (1975) |
|
Sheepshead minnow |
9 mm |
Marine-grade |
stat / 25 °C; |
96-h LC50 |
0.72 n |
Borthwick & Patrick (1982) |
|
Sheepshead minnow |
12 mm |
Marine-grade |
flow / 24 °C; |
96-h LC50 |
3.5 n |
Borthwick & Patrick (1982) |
|
Id (Leuciscus idus melanotus) |
n.sp. |
Impregnation agent Z |
n.sp. / n.sp. |
48-h LC50 |
50–100 |
Willeitner & Dieter (1984) |
|
Zebrafish |
n.sp. |
Creosote PTT |
stat / (OECD Guideline 203) |
24-h LC50 |
5.5 n |
IUCLID (1995) |
|
Creosote SNCF (n.sp.) |
stat / (OECD Guideline 203) |
96-h LC80 |
6.6 n |
|||
|
Bleak |
n.sp. |
Swedish creosote products, 1984, n = 5 |
n.sp. / n.sp. |
96-h LC50 |
7.93–10.52 n |
Sundström et al. (1986) |
|
a |
Abbreviations used: APHA = American Public Health Association; flow = flow-through conditions; LC50 = median lethal concentration; m = based on measured concentrations; n = based on nominal concentrations; n.sp. = not specified; OECD = Organisation for Economic Co-operation and Development; ORSANCO = Ohio River Valley Water Sanitation Commission, USA; stat = static conditions; TEG = triethylene glycol. |
|
b |
95% confidence intervals in parentheses. |
|
c |
Highest observed concentration inducing no mortality. |
In studies expressing results in terms of percent creosote in water, acute toxicity bioassays with a mixture of American creosote-P2 and PCP (1:1) according to established procedures of the US EPA (1995) gave a 48-h LC50 of 0.01 (95% CI = 0.008–0.015) and a 96-h LC50 of 0.006 (95% CI = 0.005–0.007) in fathead minnows (Pimephales promelas; 14 days of age, 20 °C) (Engwall et al., 1999).
Groundwater (obtained from the American Creosote Works [ACW] site) contaminated with creosote and some PCP was acutely toxic to fish embryos (inland silverside, Menidia beryllina; n = 30 per group), causing 100%/ 100%/80% mortality at 100%/10%/1% concentrations, respectively. Terata occurred in 100% and 67% of dead embryos at the 10% and 1% concentrations, respectively. At the 1% concentration, all hatched larvae (20%) had terata, including stunted skeletal axes and deformed hearts (Mueller et al., 1991a). Toxicity and teratogenicity of groundwater samples decreased only slightly after 14 days of biotreatment with indigenous microorganisms, which removed selectively (to 80–100%) a series of creosote components. Thus, residual constituents (mainly higher-molecular-weight PAHs, PCP, and other persistent contaminants) are thought to be responsible for the observed effects (Mueller et al., 1991a). Similar results were noted during a later study (Middaugh et al., 1994a,b). According to Middaugh et al. (1991), groundwater from the ACW site contained 210 mg total identified organics/litre (about 40–50 compounds).
Water from a stream flowing through the abandoned ACW site showed a concentration of 0.28 mg total identified organics/litre (about 40–50 compounds). This streamwater caused significant (compared with controls) teratogenic responses in the fish (Menidia beryllina) embryo test at a concentration of 100%, but not at 10% and 1% (Middaugh et al., 1991).
Another study (Vines et al., 2000) demonstrated that diffusible creosote-derived compounds from weathered creosote-treated pilings were able to disrupt normal development in the Pacific herring (Clupea pallasi) in a concentration-dependent manner. Effects included cessation of early development, abnormal cardiovascular function, alterations in the movement of developing embryos or larvae, decreased hatching success, and abnormal larval morphology. The LC50 for hatching success was calculated to be 0.05 mg/litre (total n = 2 × 100 eggs; 10 creosote concentrations). The hatching rate of embryos exposed to creosoted wood was 90% lower than that of control embryos (seawater alone) and 72.4% lower than that of embryos exposed to untreated wood. Partial hatching (incomplete hatch) was observed in 15–20% of creosote-exposed embryos. All embryos adhering directly to the creosote-treated wood and 40–50% of embryos not adhering to the creosote-treated wood failed to develop beyond the first few days of incubation. Surviving embryos showed a series of adverse effects, such as a 93% reduction in heart rate, a moderate to marked arrhythmia, and an increase in frequency and an alteration in pattern of embryonic/ larval movement, including tremors. Morphological deformities in hatched larvae exposed as embryos to creosoted wood included scoliosis, pericardial oedema, and ascites.
Congruently, a 72% decrease in hatching success (compared with controls) as well as larval abnormalities were recorded in herring (Clupea pallasi) embryos, which were collected from creosote-treated pilings in a natural spawning site (San Francisco Bay, USA) and monitored in the laboratory (Vines et al., 2000).
Cores of creosote-contaminated stream sediments from the ACW site were placed in aquaria (also containing beach sand) in such numbers to ascertain survival of the test fish, juvenile guppies (Poecilia reticulata), for up to 2 months. After 43 days of exposure to such sublethal concentrations of creosote components (varying concentrations in the ng/litre to µg/litre range for 12 PAHs monitored), an average 50-fold induction in CYP1A1 in the liver was observed (Schoor et al., 1991).
Sediments and associated waters from the Elizabeth River (Virginia, USA), which were contaminated by creosote-derived PAHs (from a former wood preservation plant) and by several other contaminants (including heavy metals), were found to be acutely toxic to estuarine fish (spot, Leiostomus xanthurus) in laboratory experiments (Hargis et al., 1984; Roberts et al., 1989). All fish (n = n.sp.) exposed in aquaria (with sediment layered on the bottom) to highly contaminated Elizabeth River sediment (total PAH concentration: 21 000–33 100 mg/kg dry weight) died within 2 h (in contrast to surviving controls exposed to reference sediment). The 24-h LC50 was given as 56% Elizabeth River sediment. The LC50 values decreased with increasing duration of exposure (51%, 16%, 2.9%, and 2.5% after 7, 12, 21, and 28 days, respectively) (Hargis et al., 1984; Roberts et al., 1989). Similarly, sediments collected near a wood-preserving plant on Thunder Bay Harbour, Canada, and highly contaminated by creosote (oil and grease content: 7600–80 000 mg/kg), PCP, metals, and other toxicants were acutely toxic to fathead minnows (Pimephales promelas) during a 10-day laboratory exposure study (Metcalfe & Hayton, 1989). Sediments contaminated by a mixture related to creosote (weathered coal tar collected from a river) were toxic to shortnose sturgeon (Acipenser brevirostrum) embryos and larvae in laboratory exposures (Kocan et al., 1996).
Sediments artificially contaminated with creosote (marine grade, manufactured by Koppers, USA) have also been tested (Sved et al., 1992, 1997; Sved & Roberts, 1995). In this experimental series, spots (Leiostomus xanthurus) were exposed to suspended creosote-containing sediment in a flow-through system. Acute toxicity tests conducted according to established guidelines (e.g., APHA, 1985; ASTM, 1989) resulted in a 96-h LC50 of 1740 µg total resolvable PAHs/litre (95% CI = 1480–2060 µg PAHs/litre), based on measured concentrations (Sved & Roberts, 1995). Additionally, spots (n = 4 per group) were exposed to mean total resolvable PAH concentrations of 16, 35, 76, 150, or 320 µg/litre over 14 days (0, 1, 2, 4, 7, 10, 14 days). Fish at all test concentrations (but not control fish) refused food. Hepatic EROD activity was dependent on PAH concentration and length of exposure. It increased at 35 µg/litre and higher concentrations during the first 2 days of exposure and then declined; by day 7, there were no significant differences compared with controls. At 76 µg/litre and higher concentrations, severe fin erosion, epidermal lesions, and mortality were observed (Sved et al., 1992).
In order to attribute the observed effects to a particular subset of PAH compounds, two selected fractions of creosote obtained by distillation, a high-molecular-weight fraction (HMWF) and a low-molecular-weight fraction (LMWF) were subjected to similar tests. Spots (Leiostomus xanthurus) (n = 8 per group) were exposed (in the flow-through system) to suspended sediments mixed with each fraction for 10 days. The total resolvable PAH concentrations were not significantly different between the LMWF (49 µg/litre) and the HMWF (72 µg/litre) exposures. However, except for phenanthrene, the percent composition of the six most abundant creosote PAHs (naphthalene, acenaphthene, fluorene, phenanthrene, fluoranthene, pyrene) was quite different for both fractions. The composition of the HMWF was similar to that of environmentally weathered creosote. Exposure to the HMWF resulted in mortality, epidermal lesions, fin erosion, and temporary induction of hepatic EROD activity. None of these effects occurred in fish exposed to LMWF or uncontaminated sediment. Fish exposed to LMWF did develop symptoms, but of minor severity, such as epidermal lesions limited to the area surrounding the mouth, nares, and opercula (Sved et al., 1997).
Intraperitoneal administration of extracts (solvent for extraction: mixture of acetone/cyclohexane/ methanol; solvent for administration: olive oil) of creosote-containing sediments (from Lake Jamsanvesi, Finland) to rainbow trout (Oncorhynchus mykiss) led within 96 h after single injection to induction of hepatic EROD activity and to increased levels of PAH metabolites in bile (determined as 1-pyrenol equivalents), similar to administration of creosote alone or creosote-spiked sediments. Marked effects were seen at doses of 100 mg total PAHs/kg body weight (Hyötyläinen & Oikari, 1999c).
Toxicity of five Swedish creosote products to higher plants has been tested with the onion (Allium cepa) according to a standard method (Fiskesjö, 1985), measuring reduction of root lengths during 4 days of exposure (in the presence of 0.5% acetone). The 96-h EC50 values ranged from 18 to 34 mg/litre medium (Sundström et al., 1986).
A root elongation test using lettuce (Lactuva sativa) resulted in an EC50 of 52% (for growth suppression) after exposure to creosote-contaminated sediment elutriate (containing 25 ppm creosote, basis not specified, measured by infrared spectroscopy) (Athey et al., 1989).
Sediment samples (n = 3) from a creek adjacent to a wood treatment site (in Mississippi, USA) caused mortality in earthworms (Eisenia foetida), with LD50 values ranging from 28 to 58%. Creosote concentrations measured by infrared spectroscopy ranged from 693 to 95 000 ppm (basis not specified) (Athey et al., 1989).
Different creosote-contaminated soil samples collected from wood treatment facilities in Canada were also acutely toxic to earthworms (Eisenia foetida, mature, n = 10 per group) in 14-day survival tests. All earthworms exposed to soil 1 (1320 mg total PAHs/kg dry weight, sum of 16 PAHs) and soil 2 (1500 mg total PAHs/kg dry weight) died within 1–2 days. In soil 3 (20 mg total PAHs/kg dry weight), all earthworms survived for 14 days and 50% for 41 days. Survival of earthworms in control soil was 97–100%. Exposure of the worms to 3.13% or more of soils 1 and 2 resulted in 100% mortality by days 4–7. The toxicity of the soils could not always be predicted based on chemical concentrations alone. Soils having a low ratio of PAHs to total DCM-extractable organics have higher cumulative earthworm survival times, as measured by earthworm days. Slurry-phase biotreatment (with adapted microorganisms for 52 days) of soil 1 and soil 2 eliminated acute toxicity in soil 1 (all earthworms survived for 14 days), but not in soil 2 (all earthworms died within 2 days); biotreatment-related decreases in PAHs were observed in both soils, with the greatest decrease in soil 1. Earthworm activity decreased with increasing concentration and time of exposure to the contaminated soils. Worms burrowed into soil only in the 3.13% contaminated soil, control soil, and biotreated soil 1 (Charrois et al., 2001).
Two bird species, bobwhite quail (Colinus virginianus) and mallard duck (Anas platyrhynchos), were tested in an 8-day feeding study with a mixture of creosote and coal tar (60/40). This mixture was dissolved in corn oil and added to the diet in a series of dosage levels. The 14-day-old birds received the test diet for 5 days and then were put on a toxicant-free diet for an additional 3-day observation period. The resulting 8-day LC50 values were 1261 (744–2139) mg/kg diet for bobwhite quail and 10 388 (1177–91 712) mg/kg diet for mallard duck, with estimated no-observed-effect levels (NOELs) of 215 and 2150 mg/kg diet, respectively (Webb, 1975). Another report (USDA, 1981) stated an LD50 of 10.5 mg creosote/kg body weight for ducks (no further details given).
The only vertebrate species, a gravid female gray-tailed vole (Microtus canicaudus), included in a terrestrial microcosm study did not exhibit any acute effects on exposure to creosoted wood, but showed a significant reduction in predation of crickets (Gile et al., 1982).
Benthic microbial populations of aquatic environments heavily polluted with creosote PAHs have been found to be adversely affected.
In a stream (Bayou Bonfouca, Louisiana, USA), the abundances of viable benthic bacteria, fungi, and protozoa were much lower at the contaminated sites than at the control site, as determined by ATP analysis and direct counts of sediment samples. The biomass decreased with increasing contamination (Catallo & Gambrell, 1987).
In creosote-contaminated (estuarine) sediments from the Elizabeth River (Virginia, USA), the bacterial production measured as [3H]thymidine uptake was reduced in a dose-dependent manner with increasing PAH concentrations; the bacterial biomass (determined by direct counts and viable counts of total heterotrophs) was found to be depressed in the most contaminated sediments (mean total resolvable PAH concentrations: 10.9–259 mg/kg dry weight for four stations in the Elizabeth River vs. 1.45 mg/kg dry weight for one control station in the York River) (Koepfler & Kator, 1986).
Soil microorganisms in uncontaminated (n = 5) and creosote-contaminated (n = 4) soils from different locations in Canada have been examined for functional diversity and community structure by using sole carbon source utilization patterns. There did not appear to be significant differences in Shannon diversity and richness indices, principal component analysis, or colour development rank plots between contaminated and control soils (total PAH concentrations: 174–2305 vs. not present – 0.63 mg/kg soil, wet or dry weight not specified) (Derry et al., 1998).
However, there are a number of other limitations in using soil carbon source utilization tests for assessing microbial functional diversity and community structure, as outlined by Preston-Mafham et al. (2002). For example, soil storage at low temperature can reduce and differentially affect bacterial, actinomycete, and fungal populations. Soils in this study were stored at 4 °C.
There are no studies available.
Hyperplasia in ovicells has been observed in estuarine bryozoans (Schizoporella unicornis) growing in an estuary in close proximity to coal tar derivatives, including creosote. The changes could also be induced experimentally within 7–9 days, when normal colonies were transferred to the contaminated site (Powell et al., 1970).
In mussels (Anodonta anatina) deployed in cages in a creosote-contaminated Lake Jamsanvesi in central Finland for 10 months, glycogen and protein contents of adductor muscle were analysed as bioenergetic markers of possible long-term effects related to creosote exposure. Mussels nearest the contaminated site contained the highest total PAH concentrations and had the lowest glycogen and protein concentrations in their adductor muscles. The adverse effects are thought to be caused by chemical stress due to creosote components (Hyötyläinen et al., 2002).
Ceriodaphnia dubia (crustacean) exposed in situ (in exposure chambers) to creosote-contaminated sediment of the Little Scioto River (Ohio, USA) for 48 h showed survival rates of 14–82.5% (mean: 45.5%; n = 7 sample periods) versus 75–98% (mean: 85.7%; n = 7) at the upstream uncontaminated reference site (Sasson-Brickson & Burton, 1991). Thus, toxicity in situ was somewhat lower than in corresponding laboratory tests (see section 9.1.2.2; Sasson-Brickson & Burton, 1991).
Tagatz et al. (1983) conducted studies of estuarine macrobenthic animal communities that were colonized on uncontaminated and artificially creosote-contaminated sediment for 8 weeks in aquaria; concentrations used were 0, 177, 884, and 4420 mg/kg sand (nominal; marine-grade creosote). They found a significant reduction in the number of individuals and species, progressively differing from control with increasing creosote concentration. The abundances of echinoderms, annelids, and arthropods were affected at all concentrations tested, whereas molluscs were not affected at the lowest concentration. Changes in indices of species diversity and dominance occurred at the middle and high concentrations.
Counts of the benthic meiofauna (nematodes, oligochaetes, others) from creosote-contaminated sites of a stream (Bayou Bonfouca; see section 9.2.1) showed significant reductions in these populations due to increasing levels of creosote. According to the authors, this response may be related to depressed microbenthic activity (Catallo & Gambrell, 1987).
Fish (mummichog, also known as killifish, Fundulus heteroclitus, a small non-migratory estuarine species) inhabiting a site in the Elizabeth River (Virginia, USA) heavily contaminated with PAHs (2200 mg/kg dry sediment), primarily originating from creosote, showed various pathological abnormalities, including high prevalences of hepatic and extrahepatic neoplasms (Vogelbein et al., 1990; Vogelbein, 1993; Fournie & Vogelbein, 1994, and references therein).
Vogelbein et al. (1990) reported grossly visible hepatic lesions in 93% (56/60) of adult mummichogs (Fundulus heteroclitus). Hepatocellular carcinomas were detected in 33% (20/60) and foci of cellular alterations in 73.3% (44/60) of the fish. The majority of these fish also exhibited moderate to severe hepatocellular lipoidosis and ceroidosis, which also occurred in fish (n = 30) from a less contaminated site (61 mg PAHs/kg dry sediment). Neoplastic lesions were not detected at the less contaminated site and at a relatively uncontaminated reference site (3 mg PAHs/kg dry sediment; n = 15). In addition to liver lesions, 20 exocrine pancreatic neoplasms were recorded in a group of about 1300 mummichogs collected at the heavily contaminated site over a 2-year period (between October 1989 and 1991). The prevalence of pancreatic neoplasms in subsamples was 3.3% (8/240, captured during October 1991, all size classes) or 6.7% (8/120, captured during October 1991, total length >75 mm): 5% (6/120) adenomas and 1.7% (2/120) carcinomas. All specimens with pancreatic neoplasms also had hepatocellular lesions. Other proliferative lesions observed (no numbers given) included neoplasms of the bile ducts, vascular system, kidney, and lymphoid tissues (Fournie & Vogelbein, 1994). Additionally, hepatic lesions of mummichogs collected from this site were found to contain depressed levels of CYP1A1 compared with adjacent normal liver tissue (Van Veld et al., 1992).
Although mummichogs (Fundulus heteroclitus) from the contaminated Elizabeth River location showed chronic lesions, they were resistant to the acute effects of the creosote-contaminated sediment — in contrast to fish from a reference site (Van Veld et al., 1991; Armknecht et al., 1998). Another study evaluating teratogenic effects (cardiac abnormalities) in field-caught and laboratory-raised mummichog embryos from a highly creosote-contaminated Elizabeth River site and a reference site (York River) also found indications of an enhanced tolerance to local contaminated sediments (Ownby et al., 2002). Other recent studies testing several toxicological end-points confirmed a decreased susceptibility of mummichog from a highly creosote-contaminated site on the Elizabeth River. Moreover, they found out that these effects were evident in one generation but to a lesser degree in subsequent generations under clean laboratory conditions (Meyer & Di Giulio, 2002; Meyer et al., 2002, and references therein). Reduced macrophage activities were found in spot (Leiostomus xanthurus) and hogchoker (Trinectes maculatus) captured from the polluted part of the Elizabeth River. The chemotactic and phagocytic efficiencies of kidney macrophages were significantly reduced compared with fish from control rivers (Weeks & Warinner, 1986). Altered phagocytic activity of peritoneal macrophages was also found in oyster toadfish (Opsanus tau) from this site (Seeley & Weeks-Perkins, 1991).
Elevated prevalences of hepatic neoplasms and other hepatic lesions have also been found in fish from a heavily creosote-contaminated coastal environment: Eagle Harbor, Puget Sound (Washington, USA). Adult English sole (Parophrys vetulus, a bottom-dwelling, non-migratory marine fish species) were collected in 1983–1984 from three polluted harbour sites (mean total PAH concentrations: 2.8–120 mg/kg dry sediment) and examined (Malins et al., 1985). They were affected by hepatic neoplasms (e.g., hepatocellular carcinomas, cholangiocellular carcinomas) at 27% (20/75) and by foci of cellular alterations (putative preneoplastic lesions) at 44% (33/75). These lesions not only were undetectable in fish from the reference area (n = 40), but were either not detected or detected at low prevalences (1.1–2.5%) in fish from four previously sampled sites near Eagle Harbor (7–11 km away) (Malins et al., 1984, 1985). English sole (prespawning females, n = 41–50 per group) sampled during the 1986 and 1987 spawning seasons from Eagle Harbor showed reproductive impairment (Johnson et al., 1988).
The detection of DNA–PAH adducts in tissues of fish from creosote-contaminated sites is discussed in section 6.6.
Some studies (discussed in the following paragraphs) employed outdoor experimental microcosms composed of fresh water (approximately 12 000 litres) from an irrigation pond and sifted sediment, which were dosed with defined amounts of liquid creosote and exposed to natural sunlight and precipitation (Karrow et al., 1999; Whyte et al., 2000; Sibley et al., 2001a,b).
One of these studies assessed the response of zooplankton communities to single applications of creosote in freshwater microcosms (Sibley et al., 2001a). Marine-grade liquid creosote (Stella-Jones, Vancouver, British Columbia, Canada) was applied (by subsurface injection) to 14 microcosms at nominal concentrations ranging from 0.06 to 109 mg/litre; two additional microcosms served as controls (see Bestari et al., 1998a; section 4.1.2). There was a total of 86 species belonging to four major groups (cladocerans, copepods, ostracods, and rotifers). Creosote induced a rapid, concentration-dependent reduction in zooplankton abundance and number of taxa, with maximum response (50–100% reduction in population densities) occurring between 5 and 7 days after treatment. Many of these taxa recovered to control levels during the post-treatment period, with the degree and duration of recovery being strongly dependent on creosote concentration. A significant shift in species composition was found at concentrations greater than 1.1 mg/litre. Based on nominal creosote concentrations, effect concentrations, EC50 (95% CI) estimated for total zooplankton abundance were 44.6 (40.9–48.2) and 46.6 (45.8–47.4) µg/litre at 5 and 7 days, respectively. The corresponding no-observed-effect concentrations (NOECs) were 13.9 and 5.6 µg/litre, respectively. Based on measured sum PAHs, the EC50 values amounted to 5.3 (2.7–5.9) and 2.9 (2.6–3.3) µg/litre, and the NOEC values were 7.3 and 3.7 µg/litre, respectively.
As part of the above study (Sibley et al., 2001a), effects of creosote on freshwater phytoplankton populations were also assessed (Sibley et al., 2001b). Phytoplankton (approximately 200 species belonging to Chlorophyceae, 48–81% of total abundance, Cyanophyceae, Euglenophyceae, Chrysophyceae, Bacillariophyceae, Cryptophyceae, and Dinophyceae) was sampled on days 7 and 1 before treatment and at days 7 and 21 after treatment. Creosote had no direct adverse effect on the phytoplankton community based on total abundance and number of taxa. On the contrary, population densities and number of taxa in most treatments exceeded those in the controls and exhibited a parabolic relationship relative to creosote concentration. This response can be attributed to reduced grazing pressure resulting from the significant impact on zooplankton populations (Sibley et al., 2001a, b).
Further microcosm studies tested the immunotoxic potential (Karrow et al., 1999, 2001) and other effects (Whyte et al., 2000) of creosote (manufacturer, etc., not specified) in fish. Following the dosing of microcosms with creosote (after 103–108 days), female rainbow trout (Oncorhynchus mykiss) were added to the microcosms for a 28-day period under static conditions. Karrow and co-workers used initial creosote concentrations (nominal) of 0, 5, 9, 17, 31, 56, and 100 µl/litre and found adverse alterations in several immunological parameters of the fish (n = 15 per concentration, n = 30 in control). Concentration-dependent changes in immunological parameters were observed. The LOEC of these immunological effects was 17 µl creosote/litre (based on nominal concentration), corresponding to a total PAH concentration of 611.63 ng/litre in the water (measured on day 15 of exposure). At 100 µl creosote/litre, all fish died within 3 days of exposure. Mortalities observed at the lower creosote concentrations appeared not to be related to nominal creosote concentrations (Karrow et al., 1999).
In a follow-up study, it was found that the creosote-induced immunomodulation not only was concentration-dependent, but also was dependent on the duration of exposure, showing an initial stimulatory or inhibitory response, then returning to near control levels after 28 days of exposure (Karrow et al., 2001).
Additionally, rainbow trout (Oncorhynchus mykiss) (n = 10 per group) in microcosms dosed with 0, 3, or 10 µl creosote/litre (corresponding to 0, 1158.9, and 2030.6 ng total PAHs/litre in water, measured at the start of exposure) were tested for eye damage (changes in lens optical quality) and hepatic EROD activity. After 28 days of creosote exposure, the optical quality of lenses (sharpness of focus) was significantly reduced, as indicated by an increase in focal length variability, and EROD activity was significantly elevated compared with controls. Both effects rose with creosote dose (Whyte et al., 2000).
Field studies on the effects of creosote on terrestrial plants have not been reported.
A recent study reports effects of creosote contamination on soil invertebrates. In a soil contaminated with creosote about 50 years ago, several changes in composition and abundance of soil invertebrate (nematodes, collembolans, mites) and microbial communities were observed with respect to PAH content (and other parameters) of soil. Results indicate that both indirect effects (via prey, changes in microhabitat, etc.) and direct toxicity of creosote may alter complex soil communities. For example, fungal biomass was negatively associated with PAH concentrations, but bacterial populations correlated positively. Correspondingly, bacterivorous nematodes proliferated due to PAH contamination, while fungivorous nematodes (and other groups) were reduced. The abundance of certain nematodes (Paratylenchidae) correlated negatively with BaP and an unidentified PAH (Blakely et al., 2002).
In 1973, creosote poisoning (death, weals on skin, hepatic necrosis, and gastric ulcers) was diagnosed in black rhinoceroses (Diceros bicornis) kept in creosoted holding pens in the former Transvaal, South Africa (Basson & Hofmeyer, 1973; Basson, 1987). Another report described that 7 out of 20 black rhinoceroses died after being moved into newly built, creosote-treated holding pens in Zimbabwe in 1990. As with the earlier reports mentioned above, neither type nor concentrations of creosote involved were reported (Kock et al., 1994).
Some cases of suspected creosote poisoning (deaths) of farm animals in the years 1920–1940 have been reported from the USA and Australia. Mostly cattle that had access to freshly creosoted wood (railway ties, telephone poles, fences) were affected (Hanlon, 1938; Harrison, 1959; Olafson & Leutritz, 1959; Henningsson, 1983). In Canada, a case of creosote poisoning in cattle occurred probably due to drinking of creosote from an open drum left in the corral (Cribb, 1968). Topical application of a mixture of 60% creosote and 40% fuel oil used as a cure for ringworm also turned out to be poisonous to cattle, resulting in deaths of 6 out of 47 steers and heifers (Blandford et al., 1968; Clarke & Clarke, 1975; Humphreys, 1988).
Studies on experimental application of creosote to farm animals are addressed in sections 7.1, 7.2, and 7.4.
The chemical composition of creosotes is influenced by the origin of the coal and also by the nature of the distilling process; as a result, the creosote components are rarely consistent in their concentration. Further, the composition of creosote varies greatly from country to country due to national/international regulations. One of the creosote components of regulatory concern is BaP.
Previously, the main interest was concentrated mostly on the (non-heterocyclic) PAHs in creosote, because a number of these are known carcinogens and because PAHs represent the largest chemical group in creosote itself. More recent studies have involved the identification, quantification, and evaluation of other components — for example, BTEX, nitrogen-containing heterocycles, sulfur-containing heterocycles, or phenolics, which are more soluble in water and are found at a much higher percentages in leachate, contaminated water, soil, and sediment.
The general population can be exposed to creosote or creosote components by handling creosote itself or products containing creosote and by contact with creosote-contaminated air, water, soil, or food. Routes of exposure include inhalation, drinking/ingestion, and skin contact.
Due to restrictions on the use of creosote and creosoted wood in some countries, legislation changing the composition of creosote (reduction of phenolics and BaP by the EU in recent years), and, furthermore, restrictions to consumers of creosote for home brushing and of the sale of creosoted wood (EC, 2001), exposure to these components of creosote should, in those countries, be reduced.
Populations particularly at risk of exposure include domestic applicators of creosote, persons in frequent contact with creosoted wood (e.g., equipment or garden furniture), children using playground equipment made from creosoted wood, persons living in the neighbourhood of creosote-manufacturing and wood-preserving facilities, as well as persons eating food contaminated with creosote (e.g., fish and game enclosed in creosoted containment). Additional exposures may include waste dumps and incineration sites.
Crude estimates of creosote exposure (based on BaP) have been made. For example, a daily intake of about 2 ng BaP/kg body weight has been assessed for children playing on creosoted playground equipment, and a daily intake of BaP from consumption of vegetables and fruits from gardens in the vicinity of creosoting plants has been estimated to range from 1.4 to 71.4 μg/kg body weight in adults.
Significant occupational exposure of workers to creosote components, especially in, for example, wood impregnation factories, has been reported. The main route of exposure is via skin; air monitoring alone is not sufficient for risk estimation. Exposure calculations on the basis of excreted metabolites (plus air and/or skin monitoring data) suggested a total daily uptake of 15 or 16 mg per worker (assembler or impregnator) for naphthalene. Estimations for pyrene did not exceed 5 mg/day per worker.
Deaths have been reported in humans after ingestion of 1–2 g (children) and 7 g (adults) creosote, with symptoms of acute poisoning. Some laboratory studies suggested a low to moderate acute toxicity of creosote following oral or dermal exposure.
Creosote is irritating to skin in humans and experimental animals. Photosensitizing potential has been documented in creosote-exposed workers. No specific target organ of creosote toxicity has been identified in limited short-term studies; hence, a no-observed-adverse-effect level (NOAEL) or lowest-observed-adverse-effect level (LOAEL) could not be derived.
Creosote preparations have been found to be mutagenic in in vitro and in vivo tests.
Increased risks for lip and skin cancers have been observed in cohort studies of Swedish and Norwegian wood impregnators and in Finnish round-timber workers. The possible interaction with sunlight exposure has not been adequately addressed.
Several studies in mice showed an increased frequency of skin cancer after local exposure to creosote. Clear evidence of a dose–response relationship was reported in the only multiple-dose study.
Creosote is considered to be a genotoxic carcinogen for which a threshold has not been identified.
The available studies on cancer in humans do not allow dose–response analysis.
The Buschmann et al. (1997) study examined skin carcinogenicity in mice using two samples of coal tar creosote with different BaP contents and of BaP alone. A significant increase in papillomas and squamous cell carcinomas was observed at the site of application for one creosote sample. Evaluation of the results showed a linear relationship between tumour rate and the dose of BaP in the creosote solution applied to the skin. Other organs were not examined.
An analysis of the dose–response relationship was carried out:
For the relationship between the creosote dose, expressed as BaP dose rate, and tumour rate, the following exponential function was derived:
TR = 1.31 (95% CI = 1.08–1.59) × DR0.96 (95% CI = 0.88–1.05)
where:
The exponent, ~1, shows that the relationship is linear. The slope factor 1.31 equals 4.9 × 10⁻³ tumours/mouse for a total dose of 1 µg BaP. This corresponds to a lifetime cumulative risk of 10–4 for a daily dose of creosote via dermal exposure corresponding to 1 ng BaP/kg body weight.
The fact that the experiment was terminated at 78 weeks rather than at the end of the normal life span of the animals leads to an underestimation of the true carcinogenic potency of creosote, by a factor of approximately 2.
In this study, creosote, per mg BaP, was about 5 times more carcinogenic to mice than a solution of BaP alone. Creosote is also both a cancer initiator and a promotor. Therefore, creosote has the potential of being carcinogenic to humans when they are exposed dermally.
The human monitoring data concerning this type of exposure are limited; therefore, a sample risk assessment was not included here. However, there have been attempts to estimate dermal exposure to BaP in creosote in some special-risk groups (children playing on creosoted playing equipment and residents living in the neighbourhood of creosoting plants; see Tables 21 and 22 and EC, 1999), and these data have been used by other bodies for a risk assessment.3
The composition of creosote is dependent on its source and preparation parameters, and the creosote components are rarely consistent in their type and concentration. This makes a toxicological evaluation difficult.
In the critical study, only male mice were studied, versus the standard approach of two species and both sexes, and pathological analysis was confined to the skin. BaP alone represented 20% of the total carcinogenicity of creosote. Creosote contains other components that may also affect its carcinogenic potential; therefore, different compositions may have different carcinogenic potency.
Concerning the whole database on creosote toxicity, there is a lack of information on toxicity via routes of exposure other than dermal; little information is available on general systemic toxicity, and no information is available on several end-points, such as reproductive toxicity, immunotoxicity, and organ toxicity. Risk characterization is hampered by lack of exposure data and of validated exposure markers.
The fate of creosote components is largely dependent on the physicochemical properties of the components, matrix properties, the presence of degrading or accumulating organisms, and environmental conditions. Components may be distributed to the atmosphere (the more volatile fraction), leached to water and soil (compounds with high solubilities), with the potential for migration, or sorbed onto soil or sediment particles (compounds with high Kow). Movement of sediment-sorbed creosote components may also occur through transport of colloidal material. Some creosote components are readily degradable via biotic (aerobic and anaerobic) and abiotic processes; however, many high-molecular-weight compounds are recalcitrant and may persist in the environment for decades. Degradation of creosote components often leads to the formation of transformation products (i.e., the compounds are not mineralized), which may be more toxic and mobile than the parent compound. There is also the potential for aquatic and terrestrial organisms to bioaccumulate creosote components; however, this is dependent on the bioavailability of the compounds, the organism’s mode of feed, and metabolism. The highest concentrations of creosote in the environment are generally found in sediment and soil; for example, concentrations up to several thousand mg/kg have been reported close to production/usage plants. Concentrations in surface water are generally in the mg/litre range, although concentrations an order of magnitude higher have been reported 10 years after a creosote spill.
Applications of creosoted wood in contact with water or soil may have different environmental impacts, depending on compartment-specific capacities of elimination and mobility of released creosote components.
Leaching of creosote from treated wood is the main source of emission and of the potentially inherent risks.
Several laboratory studies in aquatic microorganisms, plants, invertebrates, and fish confirmed the toxic and/or phototoxic potential of creosote or fractions of creosote. The most sensitive responses were observed with aquatic invertebrates and fish. LC50 values were as low as 20 µg/litre (invertebrates) or several hundred µg/litre (fish). An LC50 for hatching success in fish was 50 µg/litre.
More subtle effects could be demonstrated in outdoor aquatic microcosm studies. Dose-related eye damage in fish occurred in experimental ponds dosed with 3 and 10 µg creosote/litre. Adverse immunological alterations were seen in fish at a LOEC of 17 µl/litre. Investigations at the population level have been performed for zooplankton, but not fish. A microcosm study showed that zooplankton communities were adversely affected by single applications of creosote. EC50 and NOEC values (for reduction in zooplankton abundance and number of taxa) were 45 µg/litre and 6 µg/litre, respectively.
Some data based on measured PAH concentrations are available for fish exposed to suspended sediment artificially contaminated with creosote. The 96-h LC50 was about 1700 µg total resolvable PAHs/litre. At all test concentrations (16–320 µg total resolvable PAHs/litre), fish refused food; the lowest concentration that produced severe fin erosion, epidermal lesions, and mortality was 76 µg total resolvable PAHs/litre.
Laboratory exposure of invertebrates and fish to several matrices contaminated by creosote also caused acute and sublethal effects, including reproductive impairment.
Field studies provided strong associations between the occurrence of neoplastic lesions in fish and creosote contamination. Neoplasms in fish and other adverse effects in microorganisms, invertebrates, and fish were mostly documented at sites of heavy creosote contamination. However, adverse effects (e.g., developmental effects in fish) have also been observed at sites of chronic low-level input (e.g., near creosoted pilings).
Based on the few studies performed with terrestrial organisms, creosote appeared to be of moderate toxicity to standard test plants and earthworms. Studies that could be used to assess the hazard of creosote to higher terrestrial organisms were not available. Some fatal cases of suspected creosote poisoning occurred in farm animals and wildlife.
The major determinants of creosote’s environmental toxicity include not only PAHs but also (primarily in aqueous matrices) heterocyclic aromatics and phenolic compounds. The multiplicity and variability of intrinsic toxic components, their possible interactions, and the compositional changes of the mixture during transport through the environment lead to complex toxic actions. Generally, environmental weathering of creosote did not lead to a reduction of toxicity.
To date, it is not clear which creosote components may serve as indicators of environmental creosote contamination and toxicity. However, creosote may pose a significant risk to biota encountering spills or leaching events.
1) Near waste creosote sites
There are many waste sites where the input of creosote, creosote fractions, or single components into the adjacent aquatic environment exceeded the effect concentrations.
It is clear from residue analysis, toxicological profiles of acute and chronic effects being manifest, and field observations that creosote waste sites can be associated with risks to aquatic organisms.
2) Near creosoted structures
The risk for aquatic organisms in contact with wooden creosoted structures is also of concern. Some compounds have been found to diffuse from wood, resulting in aquatic concentrations that may cause adverse effects.
In soils at many creosote waste sites as well as at treated creosoted structures, contaminant concentrations are sufficient to affect terrestrial plants and soil organisms. However, adverse effects are rarely documented.
Based on a few case reports, creosote, freshly creosoted fences, etc., may pose a fatal risk for farm animals and wildlife licking them.
Due to a lack of data (exposure/effects), risk of creosote exposure for farm or feral animals cannot be evaluated.
The International Agency for Research on Cancer (IARC) classification of creosote and some of its components is given in Table 35.
Table 35: IARC classification of creosote and some of its components.
|
Substance |
Evaluationa |
Based on IARC monograph from year |
|
Creosote |
2A |
1987 |
|
Carbazole |
3 |
1983 |
|
PAHsb |
||
|
Fluorene |
3 |
1983 |
|
Phenanthrene |
3 |
1983 |
|
Anthracene |
3 |
1983 |
|
Fluoranthene |
3 |
1983 |
|
Pyrene |
3 |
1983 |
|
Benz[a]anthracene |
2A |
1973, 1983 |
|
Chrysene |
3 |
1973, 1983 |
|
Benzo[b]fluoranthene |
2B |
1973, 1983 |
|
Benzo[k]fluoranthene |
2B |
1983 |
|
Benzo[a]pyrene |
2A |
1973, 1983 |
|
Benzo[ghi]perylene |
3 |
1983 |
|
Dibenz[a,h]anthracene |
2A |
1973, 1983 |
|
Indeno[1,2,3-cd]pyrene |
2B |
1973, 1983 |
|
a |
Group 2A, the compound is probably carcinogenic to humans. |
|
Group 2B, the compound is possibly carcinogenic to humans. |
|
|
Group 3, the compound is not classifiable as to its carcinogenicity to humans. |
|
|
b |
A few PAHs are given here. For more details, see IPCS (1998) and IARC (1999). |
WHO Guidelines for Drinking-water Quality (Second Edition) for some components of creosote are given in Table 36.
Table 36: WHO Guidelines for Drinking-water Qualitya
|
Aromatic hydrocarbons |
Guideline value (µg/litre) |
Remarks |
|
Benzene |
10b |
For excess risk of 10–5 |
|
Toluene |
700 |
ATOc |
|
Xylenes |
500 |
ATO |
|
Ethylbenzene |
300 |
ATO |
|
Styrene |
20 |
ATO |
|
BaP |
0.7b |
For excess risk of 10–5 |
|
a |
From WHO (2004). |
|
b |
For substances that are considered to be carcinogenic, the guideline value is the concentration associated with an upper-bound excess lifetime cancer risk of 10–5. |
|
c |
ATO = concentrations of the substance at or below the health-based guideline value may affect the appearance, taste, or odour of the water (given as "C" in the Third Edition). |
The WHO Air Quality Guidelines (WHO, 2000) contain a guideline for BaP. Based on epidemiological data from studies in coke oven workers, a unit risk for BaP as an indicator air constituent for PAHs is estimated to be 8.7 × 10⁻⁵ per ng/m3 (0.12 ng/m3 produces an excess lifetime cancer risk of 1 × 10⁻⁵).
Acharya P, Ives P (1994) Incineration at Bayou Bounfouca remediation project. Waste Management, 14(1):13–26.
ACGIH (2000) Threshold limit values for chemical substances and physical agents; biological exposure indices. Cincinnati, OH, American Conference of Governmental Industrial Hygienists.
Alexander M (2000) Aging, bioavailability and overestimation of risk from environmental pollutants. Environmental Science and Technology, 34:4259–4265.
Allan R (1994) Phenols and phenolic compounds. In: Clayton G, Clayton F, eds. Patty’s industrial hygiene and toxicology. New York, NY, Wiley, pp. 1567–1630.
Alscher A, Lohnert G (1985) Creosote — New aspects of technical developments and environmental requirements. In: Record of the 1985 annual convention of the British Wood Preserving Association, Cambridge, 25–28 June. London, British Wood Preserving Association, pp. 55–63.
Andersson J, Bobinger S (1992) Polycyclic aromatic sulfur heterocycles. II. Photochemical oxidation of benzo[b]thiophene in aqueous solution. Chemosphere, 24:383–389.
Andersson K, Levin J-O, Nilsson C-A (1983) Sampling and analysis of particulate and gaseous polycyclic aromatic hydrocarbons from coal tar sources in the working environment. Chemosphere, 12(2):197–207.
APHA (1985) Standard methods for the examination of water and wastewater, 16th ed. Washington, DC, American Public Health Association, pp. 800–823.
Ariese F, Verkaik M, Hoornweg GP, Nesse RJ, Jukema-Leenstra SR, Hofstraat JW, Gooijer C, Velthorst NH (1994)
Trace analysis of 3-hydroxy benzo[a]pyrene in urine for the biomonitoring of human exposure to polycyclic aromatic hydrocarbons. Journal of Analytical Toxicology, 18:195–204.
Armknecht S, Kaattari S, Van Veld P (1998) An elevated glutathione S-transferase in creosote-resistant mummichog (Fundulus heteroclitus). Aquatic Toxicology, 41(1–2):1–16.
Arvin E, Flyvbjerg J (1992) Groundwater pollution arising from the disposal of creosote waste. Journal of the Chartered Institution of Water and Environmental Management, 6:646–652.
Arvin E, Godsy EM, Grbic-Galic D, Jensen B (1988) Microbial degradation of oil- and creosote-related aromatic compounds under aerobic and anaerobic conditions. In: Wu YC, ed. Proceedings of the international conference on physiochemical and biological detoxification of hazardous wastes, Atlantic City, NJ, 3–5 May. Lancaster, Technomic Publishing, pp. 828–847.
Arvin E, Jensen B, Gundersen A (1989) Substrate interactions during aerobic biodegradation of benzene. Applied Environmental Microbiology, 55:3221–3225.
Arvin E, Jensen B, Gundersen A (1991) Biodegradation kinetics of phenols in an aerobic biofilm at low concentrations. Water Science and Technology, 23:1375–1384.
ASTM (1989) Guide for conducting acute toxicity tests with fishes, macroinvertebrates, and amphibians. In: Annual book of ASTM standards. Philadelphia, PA, American Society for Testing and Materials, pp. 336–355.
Athey L, Thomas J, Miller W, Word J (1989) Evaluation of bioassays for designing sediment cleanup strategies at a wood treatment site. Environmental Toxicology and Chemistry, 8(3):223–230.
Atochem (1992a) Créosote14130 Toxicité aiguë par voie orale chez le rat. Paris la Défense, 19 February (Report CIT No. 8309 TAR) [cited in IUCLID, 1995].
Atochem (1992b) Créosote14130 Effet irritant sur la peau chez le lapin. 2 May (Report CIT No. 8310 TAL) [cited in IUCLID, 1995].
Atochem (1992c) Créosote14130 Irritation oculaire aiguë chez le lapin. 2 October (Report CIT No. 8311 TAL) [cited in IUCLID, 1995].
ATSDR (2002) Toxicological profile for creosote: Update. Atlanta, GA, US Department of Health and Human Services, Public Health Service, Agency for Toxic Substances and Disease Registry, Division of Toxicology, Toxicology Information Branch, pp. 1–312.
Auer-Technikum (1988) 12. Auflage. Berlin, Auergesellschaft, 800 pp.
Axelson O, Kling H (1983) Mortality among wood preservers with creosote exposure. In: 32nd Nordic Occupational Hygiene Conference. Solna, Arbetarskyddsstyrelsen (Arbeitsschutzkommission: National Board of Occupational Safety and Health), pp. 125–126.
Baedecker MJ, Franks BJ, Goerlitz DF, Hopple JA (1988) Geochemistry of a shallow aquifer contaminated with creosote products. In: Ragone SE, ed. U.S. Geological Survey Program on Toxic Waste — Ground-water contamination: Proceedings of the 2nd technical meeting, Cape Cod, ME, 21–25 October 1985. Reston, VA, US Geological Survey, pp. A17–A20.
Bakke J, Struble C, Gustafsson J, Gustafsson B (1985) Catabolism of premercapturic acid pathway metabolites of naphthalene to naphthols and methylthio-containing metabolites in rats. Proceedings of the National Academy of Sciences of the United States of America, 82:668–671.
Ball J (1987) Soil and groundwater contamination at wood preserving plants. Proceedings of the Industrial Waste Conference, 41:347–351.
Barbaro J, Barker J, Lemon L, Mayfield C (1992) Biotransformation of BTEX under anaerobic, denitrifying conditions: Field and laboratory observations. Journal of Contaminant Hydrology, 11:245–272.
Barbee G, Brown K, Thomas J, Donnelly K, Murray H (1996) Mutagenic activity (Ames test) of wood-preserving waste sludge applied to soil. Bulletin of Environmental Contamination and Toxicology, 57:54–62.
Barker J, Patrick G, Major D (1987) Natural attenuation of aromatic hydrocarbons in a shallow sand aquifer. Ground Water Monitoring and Remediation, 7:64–71.
Basson P (1987) Poisoning of wildlife in southern Africa. Journal of the South African Veterinary Association, 58(4):219–228.
Basson PA, Hofmeyer JM (1973) 15 mortalities associated with wildlife capture operations. In: Young E, ed. The capture and care of wild animals: the work of eighteen veterinary, medical and wildlife experts. Cape Town, Human & Rousseau, pp. 151–160.
Bates ER, Akindele F, Sprinkle D (2002) American creosote site case study: Solidification/stabilisation of PCP and creosote for $64 per cubic yard. Environmental Progress, 21:79–84.
Baud-Grasset S, Baud-Grasset F, Bifulco J, Meier J, Ma T (1993) Reduction of genotoxicity of a creosote-contaminated soil after fungal treatment determined by the Tradescantia-micronucleus test. Mutation Research, 303(2):77–82.
Bauer L, Gräf W, Mueller L (1985) The phototoxic effect of polycyclic aromatic hydrocarbons (PAH) on human fibroblastic cultures. Zentralblatt für Bakteriologie, Mikrobiologie und Hygiene: Abteilung 1: Originale B: Umwelthygiene, Krankenhaushygiene, Arbeitshygiene, Präventive Medizin, 181:281–294.
Becker G, Colmsjö A, Ostman C (1999) Determination of thiaarenes and polycyclic aromatic hydrocarbons in workplace air of an aluminum reduction plant. Environmental Science and Technology, 33(9):1321–1327.
Becker L (1997) Emissionen bei thermischer Belastung von natürlichen und künstlichen Werkstoffen (Holz, Polystyrol, Epoxidharze, Polycarbonat) [Dissertation]. Munich, Technische Universität München, Institut für Chemie Weihenstephan, Lehrstuhl für Ökologische Chemie.
Becker L, Matuschek G, Lenoir D, Kettrup A (2001) Leaching behavior of wood treated with creosote. Chemosphere, 42:301–308.
Bedient P, Rodgers A, Bouvette T (1984) Groundwater quality at a creosote waste site. Ground Water, 22:318–329.
Behr M, Baecker A (1994) Quantification of creosote migration down wooden poles and the prevention of its depletion during flood irrigation. Paper prepared for the 25th annual meeting of the International Research Group on Wood Preservation, 29 May – 3 June 1994, Bali, Indonesia. Stockholm, IRG Secretariat, pp. 1–17 (IRG/WP 94-50032).
Benford D, Cocker J, Sartorelli P, Schneide T, Van Hemmen J, Firth J (1999) Dermal route in systemic exposure. Scandinavian Journal of Work, Environment and Health, 25:511–520.
Bennett J, Updegraff D, Pereira W, Rostad C (1985) Isolation and identification of four species of quinoline-degrading pseudomonads from a creosote-contaminated site at Pensacola, Florida. Microbios Letters, 29:147–154.
Bergqvist G, Holmroos S (1994) Analysis of creosote posts after 40 years of exposure. Paper prepared for the 25th annual meeting of the International Research Group on Wood Preservation, 29 May – 3 June 1994, Bali, Indonesia. Stockholm, IRG Secretariat, pp. 1–13 (IRG/WP 94-50035).
Bestari KTJ, Robinson RD, Solomon KR, Steele TS, Day KE, Sibley PK (1998a) Distribution and composition of polycyclic aromatic hydrocarbons within experimental microcosms treated with liquid creosote. Environmental Toxicology and Chemistry, 17(12):2359–2368.
Bestari KTJ, Robinson RD, Solomon KR, Steele TS, Day KE, Sibley PK (1998b) Distribution and composition of polycyclic aromatic hydrocarbons within experimental microcosms treated with creosote-impregnated Douglas fir pilings. Environmental Toxicology and Chemistry, 17(12):2369–2377.
Bianchi D, Bosetti A, Cidaria D, Bernardi A, Gagliardi I, D’Amico P (1997) Oxidation of polycyclic aromatic heterocycles by Pseudomonas fluorescens TTC1. Applied Microbiology and Biotechnology, 47:596–599.
Bieri RH, Hein C, Huggett RJ, Shou P, Slone H, Smith C, Su C (1986) Polycyclic aromatic hydrocarbons in surface sediments from the Elizabeth River subestuary. International Journal of Environmental Analytical Chemistry, 26:97–113. (stand ohne sec-Nr auch ein drittes Mal da)
Binet P, Portal JM, Leyval C (2000) Fate of polycyclic aromatic hydrocarbons in the rhizosphere and mycorhizosphere of rye grass. Plant and Soil, 227:207–213.
Birdwood G (1938) Keratitis from working with creosote. British Journal of Medicine, 2:18.
BKH (1995) Foundation of the appeal against the EC-directive on creosote. Prepared by BKH Consulting Engineers for Directorate for Chemicals and Risk Management, Netherlands Ministry of Housing, Spatial Planning and Environment, Delft, pp. 1–29.
Black JJ (1982) Movement and identification of a creosote-derived PAH complex below a river pollution point source. Archives of Environmental Contamination and Toxicology, 11:161–166.
Black JJ, Hart TF, Evans E (1981) HPLC studies of PAH pollution in a Michigan trout stream. In: Cooke M, Dennis A, eds. Chemical analysis and biological fate: Polynuclear aromatic hydrocarbons. 5th international symposium. Columbus, OH, Battelle Press, pp. 343–355.
Blair A, Linos A, Stewart P, Burmeister L, Gibson R, Everett G, Schuman L, Cantor K (1993) Evaluation of risks for non-Hodgkin’s lymphoma by occupation and industry exposures from a case–control study. American Journal of Industrial Medicine, 23(3):301–312.
Blakely JK, Neher DA, Spongberg AL (2002) Soil invertebrate and microbial communities, and decomposition as indicators of polycyclic aromatic hydrocarbon contamination. Applied Soil Ecology, 21:71–88.
Blandford T, Clark J, Hardy R (1968) Treatment of ringworm in cattle — Deaths following the use of a mixture of creosote and tractor vaporising oil. Veterinary Record, 82:323–324.
Bleeker EAJ, Van der Geest HG, Kraak MHS, De Voogt P, Admiraal W (1998) Comparative ecotoxicity of NPAHs to larvae of the midge Chironomus riparius. Aquatic Toxicology, 41:51–62.
BMU (1995) Mitteilung der Regierung der Bundesrepublik Deutschland vom 19. Bonn/Berlin, Bundesministerium für Umwelt, Naturschutz und Reaktosicherheit, June.
Bookbinder M, Butala J (2001) Dermal and inhalation creosote exposure assessment of wood-treating workers. Toxicologist, 60:17 (Abstract 83).
Borak J, Sirianni G, Cohen H, Chemerynski S, Jongeneelen F (2002) Biological versus ambient exposure monitoring of creosote facility workers. Journal of Occupational and Environmental Medicine, 44:310–317.
Borazjani H, Fergusson BJ, McFarland LK, McGinnis GD, Pope DF, Strobel DA, Wagner JL (1990) Evaluation of wood-treating plant sites for land treatment of creosote-contaminated soils. American Chemical Society (ACS) Symposium Series, 422:252–266.
Borthwick P, Patrick J (1982) Use of aquatic toxicology and quantitative chemistry to estimate environmental deactivation of marine-grade creosote in seawater. Environmental Toxicology and Chemistry, 1:281–288.
Bos RP, Jongeneelen F (1988) Nonselective and selective methods for biological monitoring of exposure to coal-tar products. In: Methods for detecting DNA damaging agents in humans — Application in cancer epidemiology and prevention. Lyon, International Agency for Research on Cancer, pp. 389–395.
Bos RP, Hulshof CTJ, Theuws JLG, Henderson PT (1983) Mutagenicity of creosote in the Salmonella/microsome assay. Mutation Research, 119:21–25.
Bos RP, Theuws JLG, Leijdekkers C-M, Henderson PT (1984a) The presence of the mutagenic polycyclic aromatic hydrocarbons benzo(a)pyrene and benz(a)anthracene in creosote P1. Mutation Research, 130:153–158.
Bos RP, Hulshof CTJ, Theuws JLG, Henderson PT (1984b) Genotoxic exposure of workers creosoting wood. British Journal of Industrial Medicine, 41:260–262.
Bos RP, Jongeneelen FJ, Theuws JLG, Henderson PT (1984c) Exposure to mutagenic aromatic hydrocarbons of workers creosoting wood. IARC Scientific Publications, 59:279–288.
Bos RP, Jongeneelen FJ, Theuws JLG, Henderson PT (1985) Detection of volatile mutagens in creosote and coal tar. Mutation Research, 156:195–198.
Bos RP, Prinsen WJ, Van Rooy JG, Jongeneelen FJ, Theuws JLG, Henderson PT (1987) Fluoranthene, a volatile mutagenic compound, present in creosote and coal tar. Mutation Research, 187:119–125.
Bosshard H (1965) Über das Ausschwitzen von Teeröl in Kiefernmasten. Holz als Roh- und Werkstoff, 23:479–483.
Bouchard M, Viau C (1999) Urinary 1-hydroxypyrene as a biomarker of exposure to polycyclic aromatic hydrocarbons: biological monitoring strategies and methodology for determining biological exposure indices for various work environments. Biomarkers, 4:159–187.
Bouchard M, Krishnan K, Viau C (1998) Urinary excretion kinetics of 1-hydroxypyrene following intravenous administration of binary and ternary mixtures of polycyclic aromatic hydrocarbons in the rat. Archives of Toxicology, 72:475–482.
Bouchard M, Pinsonneault L, Tremblay C, Weber JP (2001) Biological monitoring of environmental exposure to polycyclic aromatic hydrocarbons in subjects living in the vicinity of a creosote impregnation plant. International Archives of Occupational and Environmental Health, 74(7):505–513.
Bouchez M, Blanchet D, Vandecasteele J (1995) Degradation of polycyclic aromatic hydrocarbons by pure strains and by defined strain associations: inhibition phenomena and cometabolism. Applied Microbiology and Biotechnology, 43:156–164.
Boutwell R, Bosch D (1958) The carcinogenicity of creosote oil: its role in the induction of skin tumors in mice. Cancer Research, 18:1171–1175.
Bowman C, Muhleman M, Walters E (1984) A fatal case of creosote poisoning. Postgraduate Medical Journal, 60:499–500.
Boyland E, Sims P (1964) Metabolism of polycyclic compounds. Biochemistry Journal, 90:391–398.
Breedveld G, Karlsen D (2000) Estimating the availability of polycyclic aromatic hydrocarbons for bioremediation of creosote contaminated soils. Applied Microbiology and Biotechnology, 54(2):255–261.
Breedveld GD, Sparrevik M (2000) Nutrient-limited biodegradation of PAH in various soil strata at a creosote contaminated site. Biodegradation, 11(6):391–399.
Bressler DC, Fedorak PM (2000) Bacterial metabolism of fluorene, dibenzofuran, dibenzothiophene, and carbazole. Canadian Journal of Microbiology, 46(5):397–409.
Bressler DC, Norman JA, Fedorak PM (1998) Ring cleavage of sulphur heterocycles: How does it happen? Biodegradation, 8:297–311.
Broholm K, Jorgensen P, Hansen A, Arvin E, Hansen M (1999a) Transport of creosote compounds in a large, intact, macroporous clayey till column. Journal of Contaminant Hydrology, 39(3–4):309–329.
Broholm K, Hansen A, Jorgensen P, Arvin E, Hansen M (1999b) Transport and biodegradation of creosote compounds in a large, intact, fractured clayey till column. Journal of Contaminant Hydrology, 39(3–4):331–348.
Broholm K, Nilsson B, Sidle R, Arvin E (2000) Transport and biodegradation of creosote compounds in clayey till, a field experiment. Journal of Contaminant Hydrology, 41:239–260.
Brooks L, Hughes T, Claxton L, Austern B, Brenner R, Kremer F (1998) Bioassay-directed fractionation and chemical identification of mutagens in bioremediated soils. Environmental Health Perspectives, 106(Suppl. 6):1435–1440.
BUA (1990) Methylnaphthalene. German Chemical Society (GDCh) Advisory Committee on Existing Chemicals of Environmental Relevance (BUA). Stuttgart, Hirzel, pp. 1–142 (BUA Report 47).
Buschmann J, Bartsch W, Dasenbrock C, Ernst H, Schneider B, Preiss A (1997) Dermal carcinogenicity study of two coal tar products (CTP) by chronic epicutaneous application in male CD-1 mice (78 weeks). Unpublished report prepared by Fraunhofer Institute of Toxicology and Aerosol Research, Hanover, for Rütgers-VfT AG, Duisburg [cited (as Fraunhofer study, 1997) in Mangelsdorf et al., 1998].
Cabot S, Shear N, Shear M (1940) Studies in carcinogenesis. XI. Development of skin tumors in mice painted with 3:4-benzpyrene and creosote oil fractions. American Journal of Pathology, 16:301–312.
CanTox (1991) Exposure/risk assessment for 14 polycyclic aromatic hydrocarbons (PAH). Report prepared for Alcan Smelters and Chemicals Ltd. by CanTox Inc., Oakville, Ontario (Project No. 0489019-02) [cited in Vyskocil et al., 2000].
Casey P, Vale J (1994) Deaths from pesticide poisoning in England and Wales: 1945–1989. Human Experimental Toxicology, 13(2):95–101.
Catallo W, Gambrell R (1987) The effects of high levels of polycyclic aromatic hydrocarbons on sediment physicochemical properties and benthic organisms in a polluted stream. Chemosphere, 16(5):1053–1063.
CEPA (1993) Canadian Environmental Protection Act. Priority Substances List assessment report. Creosote-impregnated waste materials. Ottawa, Ontario, Minister of Supply and Services, 25 pp.
CEPA (1994) Canadian Environmental Protection Act. Priority Substances List assessment report. Polycyclic aromatic hydrocarbons (PAHs). Ottawa, Ontario, Minister of Supply and Services, 61 pp.
Cerniglia CE (1992) Biodegradation of polycyclic aromatic hydrocarbons. Biodegradation, 3:351–368.
Cerniglia CE, Heitkamp MA (1989) Microbial degradation of polycyclic aromatic hydrocarbons in the aquatic environment. In: Varanasi U, ed. Metabolism of polycyclic aromatic hydrocarbons in the aquatic environment. Boca Raton, FL, CRC Press, pp. 41–68.
Chadwick R, George S, Kohan M, Williams R, Allison J, Talley D, Hayes Y, Chang J (1995) Potentiation of 2,6-dinitrotoluene genotoxicity in Fischer 344 rats by pretreatment with coal tar creosote. Journal of Toxicology and Environmental Health, 44:319–336.
Chapman P, Shelton M, Grifoll M, Selifonov S (1995) Fossil fuel biodegradation: Laboratory studies. Environmental Health Perspectives, 103(Suppl. 5):79–83.
Charrois JW, McGill WB, Froese KL (2001) Acute ecotoxicity of creosote-contaminated soils to Eisenia fetida: a survival-based approach. Environmental Toxicology and Chemistry, 20(11):2594–2603.
Chu F-LE, Hale RC (1994) Relationship between pollution and susceptibility to infectious disease in the eastern oyster, Crassostrea virginica. Marine Environmental Research, 38:243–256.
Clarke EGC, Clarke ML (1975) Antiseptics, disinfectants and cleansing agents. In: Veterinary toxicology, 1st ed. London, Baillière Tindall, pp. 142–146.
Collier T, Stein J, Goksoeyr A, Myers M, Gooch J, Huggett RJ, Varanasi U (1993) Biomarkers of PAH exposure in oyster toadfish (Opsanis tau) from the Elizabeth River, Virginia. Environmental Science, 2:161–177.
Comaish J (1987) The effect of tar and ultraviolet on the skin. Journal of Investigative Dermatology, 88:61s–64s.
Cookson H (1924) Epithelioma of the skin after prolonged exposure to creosote. British Medical Journal, 68:368.
Cordier S, Poisson M, Gerin M, Varin J, Conso F, Hemon D (1988) Gliomas and exposure to wood preservatives. British Journal of Industrial Medicine, 45:705–709.
Cribb P (1968) Creosote poisoning in cattle [letter]. Veterinary Record, 82:555.
CSTEE (1999) Opinion (revised) on cancer risk to consumers from creosote containing less than 50 ppm benzo-[a]-pyrene and/or from wood treated with such creosote and estimation of respective magnitude expressed at the 8th CSTEE plenary meeting, Brussels, 4 March 1999, pp. 1–14. Available at http://europa.eu.int/comm/health/ph_risk/committees/sct/docshtml/sct_out29_en.htm.
Culp S, Gaylor D, Sheldon W, Goldstein L, Beland F (1998) A comparison of the tumors induced by coal tar and benzo[a]pyrene in a 2-year bioassay. Carcinogenesis, 19(1):117–124.
Culp S, Warbritton A, Smith B, Li E, Beland F (2000) DNA adduct measurements, cell proliferation and tumor mutation induction in relation to tumor formation in B6C3F1 mice fed coal tar or benzo(a)pyrene. Carcinogenesis, 21(7):1433–1440.
Danish EPA (1996) Odeuse Magistrateus 2. AFD Miljokontoret. Prepared for Miljo & Energi Ministeriet, Copenhagen, December, 29 pp.
Dankovic DA, Wright CW, Zangar RC, Springer DL (1989) Complex mixture effects on the dermal absorption of benzo[a]pyrene and other polycyclic aromatic hydrocarbons from mouse skin. Journal of Applied Toxicology, 9:239–244.
Davis MW, Glaser JA, Evans JW, Lamar RT (1993) Field evaluation of the lignin-degrading fungus Phanerochaete sordida to treat creosote-contaminated soil. Environmental Science and Technology, 27:2572–2576.
Dean A, Imrey H, Dusich K (1988) Adjusting morbidity ratios in two communities using risk factor prevalence in cases. American Journal of Epidemiology, 127(3):654–662.
Debnath A, Lopez de Compadre R, Hansch C (1992) Mutagenicity of quinolines in Salmonella typhimurium TA100. A QSAR study based on hydrophobicity and molecular orbital determinants. Mutation Research, 280:55–65.
DeLeon I, Ferrario J, Byrne C (1988) Bioaccumulation of polynuclear aromatic hydrocarbons by the clam, Rangia cuneata, in the vicinity of a creosote spill. Bulletin of Environmental Contamination and Toxicology, 41:872–879.
Derry A, Staddon W, Trevors J (1998) Functional diversity and community structure of microorganisms in uncontaminated and creosote-contaminated soils as determined by sole-carbon-source utilization. World Journal of Microbiology and Biotechnology, 14(4):571–578.
DIN (1984) DIN 38414 Teil 4, Deutsche Einheitsverfahren zur Wasser-, Abwasser- und Schlammuntersuchung, Schlamm und Sedimente (Gruppe S), Bestimmung der Eluierbarkeit mit Wasser (S4). Berlin, Beuth Verlag.
Distlerath L, Loper J, Dey C (1984) Aliphatic halogenated hydrocarbons produce volatile Salmonella mutagens. Mutation Research, 136:55–64.
Donnelly K, Brown K, Kampbell D (1987) Chemical and biological characterization of hazardous industrial waste: I. Prokaryotic bioassays and chemical analysis of a wood-preserving bottom-sediment waste. Mutation Research, 180(1):31–42.
Drisko R (1963) Analysis of creosote by infrared spectroscopy. Forest Products Journal, 13:156–162.
Drisko R, O’Neill T (1966) Microbiological metabolism of creosote. Forest Products Journal, 16:31–34.
Dumler FG (1962) [Hygienic characteristics of creosote use at Karaganda coal dressing plants.] Gigiena Truda i Professional’nye Zabolevanija, 6:50–52 (in Russian).
Dunn B, Fee J (1979) Polycyclic aromatic hydrocarbon carcinogens in commercial seafoods. Journal of the Fisheries Research Board of Canada, 36:1469–1476.
Dunn B, Stich H (1976) Monitoring procedures for chemical contamination in coastal waters. Journal of the Fisheries Research Board of Canada, 33:2040–2046.
Dusich K, Sigurdson E, Hall W, Dean A (1980) Cancer rates in a community exposed to low levels of creosote components in municipal water. Minnesota Medicine, 63(11):803–806.
Dust J, Thompson W (1973) Pollution control in the wood-preserving industry. Part IV. Biological methods of treating wastewater. Forest Products Journal, 23:59–66.
Dyreborg S, Arvin E (1994) Creosote leaching from a contaminated saturated sand column. Environmental Technology, 15:871–878.
Dyreborg S, Arvin E (1995) Inhibition of nitrification by creosote-contaminated water. Water Research, 29:1603–1606.
Dyreborg S, Arvin E, Broholm K, Christensen J (1996a) Biodegradation of thiophene, benzothiophene, and benzofuran with eight different primary substrates. Environmental Toxicology and Chemistry, 15(12):2290–2292.
Dyreborg S, Arvin E, Broholm K (1996b) The influence of creosote compounds on the aerobic degradation of toluene. Biodegradation, 7(2):97–107.
Dyreborg S, Arvin E, Broholm K (1996c) Effects of creosote compounds on the aerobic biodegradation of benzene. Biodegradation, 7(3):191–201.
Dyreborg S, Arvin E, Broholm E (1997) Biodegradation of NSO-compound under different redox-conditions. Journal of Contaminant Hydrology, 25:177–197.
Eastmond D, Booth G, Lee M (1984) Toxicity, accumulation, and elimination of polycyclic aromatic sulfur heterocycles in Daphnia magna. Archives of Environmental Contamination and Toxicology, 13:105–111.
EC (1976) Council Directive of 27 July 1976 on the approximation of the laws, regulations and administrative provisions of the Member States relating to restrictions on the marketing and use of certain dangerous substances and preparations (76/769/EEC). Brussels, European Commission. Available at http://www.dbp-facts.com/upload/documents/document14.pdf.
EC (1994) European Parliament and Council Directive 94/60/EC of 20 December 1994, amending for the 14th time Directive 76/769/EEC on the approximation of the laws, regulations and administrative provisions of the Member States relating to restrictions on the marketing and use of certain dangerous substances and preparations. Official Journal of the European Communities, L365:1.
EC (1999) Commission Decision of 26 October 1999 on national provisions notified by the Kingdom of Denmark concerning the limitation to the placing on the market and use of creosote. Entscheid der Kommission, Amtsblatt der EG (1999/835/EC). Official Journal of the European Communities, L329:82–99. Available at http://europa.eu.int/comm/enterprise/chemicals/derogations/index.htm.
EC (2001) Commission Decision of 13 July 2001 concerning draft national provisions notified by the Kingdom of the Netherlands on limitations on the marketing and use of creosote (2001/599/EC). Official Journal of the European Communities, L210:46–50.
Edmiston S, Maddy K (1987) Summary of illnesses and injuries reported in California by physicians in 1986 as potentially related to pesticides. Veterinary and Human Toxicology, 29(5):391–397.
Eggen T, Majcherczyk A (1998) Removal of polycyclic aromatic hydrocarbons (PAH) in contaminated soil by white rot fungus Pleurotus ostreatus. International Biodeterioration & Biodegradation, 41(2):111–117.
Ehrlich G, Goerlitz D, Goday E, Huls H (1982) Degradation of phenolic contaminants in ground water by anaerobic bacteria: St. Louis Park, Minnesota. Ground Water, 20:703–710.
Ehrlich G, Godsy M, Goerlitz D, Hult F (1983) Microbial ecology of a creosote-contaminated aquifer at St. Louis Park, MN. In: Developments in industrial microbiology. Proceedings of the 39th general meeting of the Society for Industrial Microbiology. Menlo Park, CA, US Geological Survey, pp. 235–245.
Eisenreich SJ, Looney BB, Thornton JD (1981) Airborne organic contaminants in the Great Lakes ecosystem. Environmental Science and Technology, 15:30–38.
Elder J, Dresler P (1988) Accumulation and bioconcentration of polycyclic aromatic hydrocarbons in a nearshore estuarine environment near a Pensacola (Florida) creosote contamination site. Environmental Pollution, 49:117–132.
Ellis B, Harold P, Kronberg H (1991) Bioremediation of a creosote contaminated site. Environmental Technology, 12:447–459.
Elovaara E, Heikkila P, Pyy L, Mutanen P, Riihimaki V (1995) Significance of dermal and respiratory uptake in creosote workers: exposure to polycyclic aromatic hydrocarbons and urinary excretion of 1-hydroxypyrene. Occupational and Environmental Medicine, 52:196–203.
Engwall M, Pignatello J, Grasso D (1999) Degradation and detoxification of the wood preservatives creosote and pentachlorophenol in water by the photo-Fenton reaction. Water Research, 33(5):1151–1158.
Ericson G, Liewenborg B, Näf C, Balk L (1998) DNA adducts in perch, Perca fluviatilis, from a creosote contaminated site and in perch exposed to an organic solvent extract of creosote contaminated sediment. Marine Environmental Research, 46(1–5):341–344.
Ericson G, Liewenborg B, Lindesjoo E, Naf C, Balk L (1999) DNA adducts in perch (Perca fluviatilis) from a creosote contaminated site in the river Angermanalver, Sweden. Aquatic Toxicology, 45(2–3):181–193.
Eriksson M, Dalhammar G, Borg-Karlson A (2000) Biological degradation of selected hydrocarbons in an old PAH/creosote contaminated soil from a gas work site. Applied Microbiology and Biotechnology, 53(5):619–626.
Eriksson M, Faldt J, Dalhammer G, Borg-Karlson A (2001) Determination of hydrocarbons in old creosote contaminated soil using headspace solid phase microextraction and GC-MS. Chemosphere, 44(7):1641–1648.
EU (2001) Commission Directive 2001/90/EC of 26 October 2001 adapting to technical progress for the 7th time Annex 1 to the Marketing & Use Council Directive 76/769/EEC on the approximation of the laws, regulations and administrative provisions of the Member States relating to restrictions on the marketing and use of certain dangerous substances and preparations (creosote). Official Journal of the European Communities, L283:41. Available at http://www.dti.gov.uk/ccp/consultpdf/creosote.pdf.
European Committee for Standardization (2000) Derivates from coal pyrolysis — coal tar based oils: Creosotes — specifications and test methods. Brussels, European Committee for Standardization, pp. 1–11 (Project Reference 00317007 prEN 14998; CEN/TC 317/WG 2).
Evanshen B, Knight C, Zaslow A, Scheuermann P, Lanza G (1992) In situ degradation of m-cresol in creosote contaminated soil. Abstracts of the General Meeting of the American Society for Microbiology, 92:370.
Feingold L, Savitz D, John E (1992) Use of job-exposure matrix to evaluate parental occupation and childhood cancer. Cancer Causes and Control, 3:231–245.
Fellows E (1937) Studies on calcium creosotate: III. The elimination of volatile phenols in rabbit urine after the administration of "calcium creosotate solution" and after creosote solution. Journal of Pharmacology and Experimental Therapeutics, 60:183–188.
Fellows E (1939) Calcium creosotate: V. Nature of phenols eliminated in urine. Proceedings of the Society of Experimental Biology and Medicine, 42:103–107.
Fetzner S (1998) Bacterial degradation of pyridine, indole, quinoline, and their derivatives under different redox conditions. Applied Microbiology and Biotechnology, 49(3):237–250.
Fielden M, Wu Z, Sinal C, Hodgert J, Bend J, Hammond G, Zacharewski T (2000) Estrogen receptor- and aryl hydrocarbon receptor-mediated activities of a coal-tar creosote. Environmental Toxicology and Chemistry, 19(5):1262–1271.
Finnish Institute of Occupational Health (1999) [Biomonitoring of exposure to chemicals — guideline for specimen collection, 7th ed.] Helsinki (in Finnish) [cited in Heikkilä, 2001].
Fiskesjö G (1985) The allium test as a standard in environmental monitoring. Hereditas, 102:99–112.
Flickinger C, Lawrence A (1982) Occupational health experience in the wood-preserving industry. Proceedings of the Annual Meeting of the American Wood-Preservers’ Association, 78:11–30.
Flodin U, Fredriksson M, Persson B (1987) Multiple myeloma and engine exhausts, fresh wood, and creosote: a case–referent study. American Journal of Industrial Medicine, 12:519–529.
Flyvbjerg J, Arvin E, Jensen B, Olsen S (1993) Microbial degradation of phenols and aromatic hydrocarbons in creosote-contaminated groundwater under nitrate-reducing conditions. Journal of Contaminant Hydrology, 12:133–150.
Fouchécourt MO, Arnold M, Berny P, Videmann B, Rether B, Rivière JL (1999) Assessment of the bioavailability of PAHs in rats exposed to a polluted soil by natural routes: Induction of EROD activity and DNA adducts and PAH burden in both liver and lung. Environmental Research Section A, 80:330–339.
Fournie J, Vogelbein W (1994) Exocrine pancreatic neoplasms in the mummichog (Fundulus heteroclitus) from a creosote-contaminated site. Toxicologic Pathology, 22(3):237–247.
Fowler M, Brooks P, Northcott M, King M, Barker J, Snowdon L (1994) Preliminary results from a field experiment investigating the fate of some creosote components in a natural aquifer. Organic Geochemistry, 22:641–649.
Gagne F, Trottier S, Blaise C, Sproull J, Ernst B (1995) Genotoxicity of sediment extracts obtained in the vicinity of a creosote-treated wharf to rainbow trout hepatocytes. Toxicology Letters, 78:175–182.
Gallagher J, Jackson M, George M, Lewtas J (1990) Dose-related differences in DNA adduct levels in rodent tissues following skin application of complex mixtures from air pollution sources. Carcinogenesis, 7:63–68.
Gaylor D, Culp S, Goldstein L, Beland F (2000) Cancer risk estimation for mixtures of coal tars and benzo(a)pyrene. Risk Analysis, 20(1):81–85.
Geiger J, Buikema A (1982) Hydrocarbons depress growth and reproduction of Daphnia pulex (Cladocera). Canadian Journal of Fisheries and Aquatic Sciences, 39:830–836.
Gensemer R, Ren L, Day K, Solomon K, Greenberg B (1996) Fluorescence induction as a biomarker of creosote phototoxicity to the aquatic macrophyte Lemna gibba. In: Bengston D, Henshel D, eds. Environmental toxicology and risk assessment: biomarkers and risk assessment, Vol. 5. Philadelphia, PA, American Society for Testing and Materials, pp. 163–176.
Gevao B, Jones K (1998) Kinetics and potential significance of polycyclic aromatic hydrocarbon desorption from creosote-treated wood. Environmental Science and Technology, 32(5):640–646.
Ghosal S, Weber WJ, Rummel AM, Trosko JE, Upham BL (1999) Epigenetic toxicity of a mixture of polycyclic aromatic hydrocarbons on gap junctional intercellular communication before and after biodegradation. Environmental Science and Technology, 33(7):1044–1050.
Gibson D, Subramanian V (1984) Microbial degradation of aromatic hydrocarbons. In: Gibson D, ed. Microbial degradation of organic compounds. New York, NY, Dekker, pp. 182–252.
Gile J, Collins J, Gillett J (1982) Fate and impact of wood preservatives in a terrestrial microcosm. Journal of Agricultural and Food Chemistry, 30:295–301.
Glaser J (1990) Hazardous waste degradation by wood degrading fungi. In: Kamely D, Chakrabarty A, Omenn G, eds. Biotechnology and biodegradation: International workshop, Lisbon, June 1989. Houston, TX, Gulf Publishing Co., pp. 267–284 (Advances in Applied Biotechnology Series, Vol. 4).
Glaser J, Lamar R (1995) Lignin-degrading fungi as degraders of pentachlorophenol and creosote in soil. In: Bioremediation: Science and applications: Symposium, Cincinnati, OH, 6–7 November 1993. Madison, WI, Soil Science Society of America, American Society of Agronomy, Crop Science Society of America, pp. 117–133 (Special Publication No. 43).
Godschalk RWL, Ostertag JU, Moonen EJC (1998) Aromatic DNA adducts in human white blood cells and skin after dermal application of coal tar. Cancer Epidemiology Biomarkers & Prevention, 7:767–773.
Godsy E, Goerlitz D, Grbic-Galic D (1992) Methanogenic biodegradation of creosote contaminants in natural and simulated ground-water ecosystems. Ground Water, 30(2):232–242.
Goerlitz D, Troutman D, Godsy E, Franks B (1985) Migration of wood-preserving chemicals in contaminated groundwater in a sand aquifer at Pensacola, Florida. Environmental Science and Technology, 19(10):955–961.
Goldstein L, Weyand E, Safe S, Steinberg M, Culp S, Gaylor D, Beland F, Rodriguez L (1998) Tumors and DNA adducts in mice exposed to benzo(a)pyrene and coal tars: implications for risk assessment. Environmental Health Perspectives, 106(Suppl. 6):1325–1330.
Goon D, Hatoum N, Klan M (1991) Oral bioavailability of "aged" soil-adsorbed benzo[a]pyrene (BaP) in rats. Toxicologist, 11:1356.
Grant W, Schuman J (1993) Toxicology of the eye: Effects on the eyes and visual system from chemicals, drugs, metals and minerals, plants, toxins and venoms; also, systemic side effects from eye medications, 4th ed. Springfield, IL, Charles C. Thomas Publishers, p. 475.
Grbic-Galic D (1989) Microbial degradation of homocyclic and heterocyclic aromatic hydrocarbons under anaerobic conditions. Developments in Industrial Microbiology, 30(Suppl. 4):237–253.
Grifoll M, Selifonov SA, Gatlin CV, Chapman PJ (1995) Actions of a versatile fluorene-degrading bacterial isolate on polycyclic aromatic compounds. Applied Environmental Microbiology, 61(10):3711–3723.
Grimmer G, Jacob J, Dettbarn G, Naujack K-W (1997) Determination of urinary metabolites of polycyclic aromatic hydrocarbons (PAH) for the risk of PAH-exposed workers. International Archives of Occupational and Environmental Health, 69:231–239.
Grosser R, Warshawsky D, Vestal R (1995) Mineralization of polycyclic and N-heterocyclic aromatic compounds in hydrocarbon-contaminated soils. Environmental Toxicology and Chemistry, 14(3):375–382.
Guerin T (1999) Bioremediation of phenols and polycyclic aromatic hydrocarbons in creosote contaminated soil using ex-situ land treatment. Journal of Hazardous Materials, 65(3):305–315.
Gurprasad N, Sproull J, Chau D, Constable M (1995) Polycyclic aromatic hydrocarbons in creosote impregnated waste materials from across Western Canada. International Journal of Environmental Analytical Chemistry, 60:95–99.
Hack A, Selenka F (1996) Mobilisation of PAH and PCB from contaminated soil using a digestive tract method. Toxicology Letters, 88:199–210.
Haldin-Davis H (1935) Multiple warts in a creosote worker. Proceedings of the Royal Society of Medicine, 29:89–90.
Hale R, Aneiro K (1997) Determination of coal tar and creosote constituents in the aquatic environment. Journal of Chromatography A, 774(1–2):79–95.
Hanlon G (1938) Creosote poisoning of cattle. Australian Veterinary Journal, 14:73.
Hansch C, Leo A (1979) Substituent constants for correlation analysis in chemistry and biology. New York, NY, Wiley, 211 pp.
Hargis WJ, Roberts MH, Zwerner DE (1984) Effects of contaminated sediments and sediment-exposed effluent water on an estuarine fish: acute toxicity. Marine Environmental Research, 14:337–354.
Harrison D (1959) The toxicity of wood preservatives to stock. New Zealand Veterinary Journal, 7:89–98.
Hattum B, Pons M, Montanes J (1998) Polycyclic aromatic hydrocarbons in freshwater isopods and field-partitioning between abiotic phases. Archives of Environmental Contamination and Toxicology, 35:257–267.
Heikkilä P (2001) Respiratory and dermal exposure to creosote [Dissertation]. Kuopio, University of Kuopio (Kuopio University Publications C. Natural and Environmental Sciences 120). Available at http://www.uku.fi/vaitokset/2001/.
Heikkilä P, Hämeilä M, Pyy L, Raunu P (1987) Exposure to creosote in the impregnation and handling of impregnated wood. Scandinavian Journal of Work, Environment and Health, 13:431–437.
Heikkilä P, Luotamo M, Pyy L, Riihimäki V (1995) Urinary 1-naphthol and 1-pyrenol as indicators of exposure to coal tar products. International Archives of Occupational and Environmental Health, 67:211–217.
Heikkilä P, Luotamo M, Riihimäki V (1997) Urinary 1-naphthol excretion in the assessment of exposure to creosote in an impregnation facility. Scandinavian Journal of Work, Environment and Health, 23(3):199–205.
Henningsson B (1983) Environmental protection and health risks in connection with the use of creosote. Holz als Roh- und Werkstoff, 41:471–475.
Henry SA (1946) Cancer of the scrotum in relation to occupation. New York, NY, Oxford University Press [cited in IARC, 1985].
Henry S (1947) Occupational cutaneous cancer attributable to certain chemicals in industry. British Medical Bulletin, 4:389–401.
Heyl T, Mellet W (1982) Creosote dermatitis in an ammunition depot: cases. South African Medical Journal, 62:66–67.
Hickok EA, Erdmann JB, Simonett MJ, Boyer GW, Johnson LL (1982) Groundwater contamination with creosote wastes. National conference on environmental engineering: Proceedings of the ASCE Environmental Engineering Division speciality conference, Minneapolis, MN, 14–16 July 1982. Reston, VA, American Society of Civil Engineers, pp. 430–437.
Hochman H (1967) Creosoted wood in a marine environment — a summary report. Proceedings of the Annual Meeting of the American Wood-Preservers’ Association, 63:138–150.
Hoffman RE, Hrudey SE (1990) Evaluation of the reclamation of decommissioned wood preserving plant sites in Alberta. Edmonton, Alberta, Alberta Environment [cited in CEPA, 1993].
Howsam M, Jones KC, Ineson P (2000) PAHs associated with the leaves of three deciduous tree species. I — Concentrations and profiles. Environmental Pollution, 108:413–424.
Howsam M, Jones KC, Ineson P (2001) PAHs associated with the leaves of three deciduous tree species. II — Uptake during a growing season. Chemosphere, 44:155–164.
HSDB (1999) Coal tar creosote (
Hazardous Substances Data Bank.
HSE (2003) Revocation of approvals for amateur creosote/coal tar creosote wood preservatives. United Kingdom Health & Safety Executive. Available at http://www.hse.gov.uk/hthdir/noframes/creosote.htm/.
Huang X, Dixon D, Greenberg B (1993) Impacts of UV radiation and photomodification on the toxicity of PAHs to the higher plant Lemna gibba (duckweed). Environmental Toxicology and Chemistry, 12:1067–1077.
Hudelo, Radot, Gailliau, Mornet [no initials provided] (1927) Mélanose chez un terrassier des chemins de fer, ayant manipulé des traverses infectées à la créosote. Bulletin de la Société Française de Dermatologie et de Syphiligraphie, 34:144–149.
Huggett RJ, Bender ME, Unger MA (1987) Polynuclear aromatic hydrocarbons in the Elizabeth River, Virginia. In: Dickson KL, ed. Fate and effects on sediment bound chemicals in aquatic systems. New York, NY, Pergamon Press, pp. 327–341.
Huggett RJ, van Veld PA, Smith CL, Hargis WJ, Vogelbein WK, Weeks BA (1992) The effects of contaminated sediments in the Elizabeth River. In: Burton GA, ed. Sediment toxicity assessment. Boca Raton, FL, Lewis Publishers, pp. 403–430.
Hughes J, Beckles D, Chandra S, Ward C, Pfaender F, Suflita J, Ward C (1997) Utilization of bioremediation processes for the treatment of PAH-contaminated sediments. Journal of Industrial Microbiology and Biotechnology, 18:152–160.
Hughes T, Claxton L, Brooks L, Warren S, Brenner R, Kremer F (1998) Genotoxicity of bioremediated soils from the Reilly tar site, St. Louis Park, Minnesota. Environmental Health Perspectives, 106(Suppl. 6):1427–1433.
Humphreys D (1988) Tar derivatives. In: Veterinary toxicology, 3rd ed. London, Baillière Tindall, pp. 205–207.
Huntley S, Bonnevie N, Wenning R, Bedbury H (1993) Distribution of polycyclic aromatic hydrocarbons (PAHs) in three northern New Jersey waterways. Bulletin of Environmental Contamination and Toxicology, 51:865–872.
Hyötyläinen T, Oikari A (1999a) The toxicity and concentrations of PAHs in creosote-contaminated lake sediment. Chemosphere, 38(5):1135–1144.
Hyötyläinen T, Oikari A (1999b) Assessment of toxicity hazards of dredged lake sediment contaminated by creosote. The Science of the Total Environment, 243–244:97–105.
Hyötyläinen T, Oikari A (1999c) Assessment of the bioactivity of creosote-contaminated sediment by liver biotransformation system of rainbow trout. Ecotoxicology and Environmental Safety, 44(3):253–258.
Hyötyläinen T, Karels A, Oikari A (2002) Assessment of bioavailability and effects of chemicals due to remediation actions with caging mussels (Anodonta anatina) at a creosote-contaminated lake sediment site. Water Research, 36:4497–4504.
IARC (1985) Polycyclic aromatic compounds, Part 4, Bitumens, coal-tars and derived products, shale-oils and soots. Lyon, International Agency for Research on Cancer (IARC Monographs on the Evaluation of the Carcinogenic Risk of Chemicals to Humans, Vol. 35).
IARC (1999) Carbazole. In: Re-evaluation of some organic chemicals, hydrazine and hydrogen peroxide (part three). Lyon, International Agency for Research on Cancer, pp. 1319–1323 (IARC Monographs on the Evaluation of the Carcinogenic Risk of Chemicals to Humans, Vol. 71).
Ingram LL, McGinnis GD, Gjovik LR, Roberson G (1982) Migration of creosote and its components from treated piling sections in a marine environment. Proceedings of the Annual Meeting of the American Wood-Preservers’ Association, 78:120–128.
IPCS (1987) Pentachlorophenol. Geneva, World Health Organization, International Programme on Chemical Safety (Environmental Health Criteria 71).
IPCS (1994) Phenol. Geneva, World Health Organization, International Programme on Chemical Safety, pp. 1–151 (Environmental Health Criteria 161).
IPCS (1995) Cresols. Geneva, World Health Organization, International Programme on Chemical Safety (Environmental Health Criteria 168).
IPCS (1998) Selected non-heterocyclic polycyclic aromatic hydrocarbons. Geneva, World Health Organization, International Programme on Chemical Safety, 883 pp. (Environmental Health Criteria 202).
IPCS (2002) Creosote. Geneva, World Health Organization, International Programme on Chemical Safety (International Chemical Safety Card 0572).
IRI (1979) IRI Project No. 412846, May. Inveresk Research International (unpublished report) [cited in ITC, 1990].
IRI (1981) IRI Project No. 415865, February. Inveresk Research International (unpublished report) [cited in ITC, 1990].
IRI (1982) IRI Project No. 119914, May. Inveresk Research International (unpublished report) [cited in ITC, 1990].
IRIS (2001) Integrated risk information system. Washington, DC, US Environmental Protection Agency, Office of Research and Development, National Center for Environmental Assessment. Available at http://www.epa.gov/iris.
ITC (1990) Information about coal-tar creosote for wood preservation. Prepared by Tar Industries Services (TIS) for International Tar Conference, Paris, March, pp. 1–79.
IUCLID (1995) Creosote — CAS-No.
IUCLID (2000) Creosote — CAS-No.
Iyer P, Martin J, Irvin T (1992) In vitro embryotoxicity of petroleum creosote monitored via mouse preimplantation embryo culture. Journal of Toxicology and Environmental Health, 37:231–245.
Iyer P, Irvin T, Martin J (1993) Developmental effects of petroleum creosote on mice following oral exposure. Research Communications in Chemical Pathology and Pharmacology, 82:371–374.
Johansen S, Hansen A, Mosbaek H, Arvin E (1996) Method development for trace analysis of heteroaromatic compounds in contaminated groundwater. Journal of Chromatography, 738:295–304.
Johansen S, Hansen A, Mosboek H, Arvin E (1997) Identification of heteroaromatic and other organic compounds in ground water at creosote-contaminated sites in Denmark. Ground Water Monitoring and Remediation, 17(2):106–115.
Johansen S, Arvin E, Mosboek H, Hansen A (1998) Heteroaromatic compounds and their biodegradation products in creosote-contaminated groundwater. Toxicology and Environmental Chemistry, 66(1–4):195–228.
Johnson L, Casillas E, Collier T, McCain B, Varanasi U (1988) Contaminant effects on ovarian development in English sole (Parophrys vetulus) from Puget Sound, Washington. Canadian Journal of Fisheries and Aquatic Sciences, 45:2133–2146.
Jonas A (1943) Creosote burns. Journal of Industrial Hygiene and Toxicology, 25(9):418–420.
Jongeneelen FJ (1992) Biological exposure limit for occupational exposure to coal tar pitch volatiles at cokeovens. International Archives of Occupational and Environmental Health, 63:511–516.
Jongeneelen FJ (2001) Benchmark guideline for urinary 1-hydroxypyrene as biomarker of occupational exposure to polycyclic aromatic hydrocarbons. Annals of Occupational Hygiene, 45(1):3–13.
Jongeneelen FJ, Anzion RBM, Leijdekkers C, Bos R, Henderson P (1985) 1-Hydroxypyrene in human urine after exposure to coal tar and a coal tar derived product. International Archives of Occupational and Environmental Health, 57:47–55.
Jongeneelen FJ, Anzion RBM, Theuws J, Henderson P, Bos R (1986) Biological monitoring of polycyclic aromatic hydrocarbons: metabolites in urine. Scandinavian Journal of Work, Environment and Health, 12:137–143.
Jongeneelen FJ, Scheepers PTJ, Groenendijk A, Van Aerts LAGJM, Anzion RBM, Bos RP, Veenstra SJ (1988a) Airborne concentrations, skin contamination, urinary metabolite excretion of polycyclic aromatic hydrocarbons among paving workers exposed to coal tar derived road tars. American Industrial Hygiene Association Journal, 49(12):600–607.
Jongeneelen FJ, Anzion RBM, Scheepers PTJ, Bos RP, Henderson PT, Nuenhuis EH, Veenstra SJ, Brouns RME, Winkes A (1988b) 1-Hydroxypyrene in urine as a biological indicator of exposure to polycyclic aromatic hydrocarbons in several work environments. Annals of Occupational Hygiene, 32:35–43.
Jongeneelen FJ, Bos RP, Henderson PT (1988c) Metabolites of polycyclic aromatic hydrocarbons in urine of exposed workers. Toxicology and Environmental Chemistry, 16:295–307.
Juhasz AL, Naidu R (2000) Bioremediation of high molecular weight polycyclic aromatic hydrocarbons: A review of the microbial degradation of benzo[a]pyrene. International Biodeterioration & Biodegradation, 45:57–88.
Juhasz AL, Britz ML, Stanley GA (2000a) Evaluation of a creosote-based medium for the growth and preparation of a PAH-degrading bacterial community for bioaugmentation. Journal of Industrial Microbiology and Biotechnology, 24:277–284.
Juhasz AL, Megharaj M, Naidu R (2000b) Bioavailability: The major challenge (constraint) to bioremediation of organically contaminated soils. In: Wise DL, Trantolo DJ, eds. Remediation of hazardous waste contaminated soils, 2nd ed. Vol. 1: Engineering considerations and remediation strategies, Section 1-1: Engineering issues in waste remediation. New York, NY, Dekker, pp. 217–241.
Kanaly RA, Harayama S (2000) Biodegradation of high molecular weight polycyclic aromatic hydrocarbons by bacteria. Journal of Bacteriology, 182:2059–2067.
Karlehagen S, Andersen A, Ohlson C (1992) Cancer incidence among creosote-exposed workers. Scandinavian Journal of Work, Environment and Health, 18:26–29.
Karrow N, Boermans H, Dixon D, Hontella A, Solomon K, Whyte J, Bols N (1999) Characterizing the immunotoxicity of creosote to rainbow trout (Oncorhynchus mykiss): a microcosm study. Aquatic Toxicology, 45(4):223–239.
Karrow NA, Bols NC, Whyte JJ, Solomon KR, Dixon DG, Boermans HJ (2001) Effects of creosote exposure on rainbow trout pronephros phagocyte activity and the percentage of lymphoid B cells. Journal of Toxicology and Environmental Health A, 63(5):363–381.
Keck J, Sims R, Coover M, Park K, Symons B (1989) Evidence for cooxidation of polynuclear aromatic hydrocarbons in soil. Water Research, 23:1467–1476.
Keimig S, Morgan D (1986) Urinary 1-naphthol as a biological indicator of naphthalene exposure. Applied Industrial Hygiene, 1:61–65.
Keimig S, Kirby K, Morgan D (1983) Identification of 1-hydroxypyrene as a major metabolite of pyrene in pig urine. Xenobiotica, 13:415–420.
KEMI (1995) Hazard assessments / chemical substances selected in the Swedish Sunset Project, KEMI. Prepared for the Swedish National Chemicals Inspectorate, pp. 247–266
(Report No. 12/95, Supplement to KEMI Report 13/94).
Kerr MA, Nasca PC, Mundt KA, Michalek AM, Baptiste MS, Mahoney M (2000) Parental occupational exposures and risk of neuroblastoma: a case–control study (United States). Cancer Causes and Control, 11(7):635–643.
Kieley KM, Matheson RAF, Hennigar PA (1986) Polynuclear aromatic hydrocarbons in the vicinity of two Atlantic region wood preserving operations. Prepared for Environmental Protection Service, Environment Canada, 35 pp. (EPS-5-AR-86-3).
Kiilerich O, Arvin E (1996) Ground water contamination from creosote sites. Water Monitoring Review, 6(1):112–117.
King J, Coley K (1984) Toxicity of coal-distillates to Spirodela polyrrhiza. Bulletin of Environmental Contamination and Toxicology, 33:220–224.
King M, Barker J (1999) Migration and natural fate of a coal tar creosote plume: 1. Overview and plume development. Journal of Contaminant Hydrology, 39:249–279.
King M, Barker J, Devlin J, Butler B (1999) Migration and natural fate of a coal tar creosote plume. 2. Mass balance and biodegradation indicators. Journal of Contaminant Hydrology, 39:281–307.
Kipopoulou AM, Manoli E, Samara C (1999) Bioconcentration of polycyclic aromatic hydrocarbons in vegetables grown in an industrial area. Environmental Pollution, 106:369–380.
Klingner T, McCorkle T (1994) The application and significance of wipe samples. American Industrial Hygiene Association Journal, 55:251–254.
Kocan R, Matta M, Salazar S (1996) Toxicity of weathered coal tar for chortnose sturgeon (Acipenser brevirostrum) embryos and larvae. Archives of Environmental Contamination and Toxicology, 31:161–165.
Kochany J, Maguire R (1994) Photodegradation of quinoline in water. Chemosphere, 28:1097–1110.
Kochevar IE, Armstrong RB, Einbinder J, Walther RR, Harber LC (1982) Coal tar phototoxicity: Active compounds and action spectra. Photochemistry and Photobiology, 36:65–69.
Kock ND, Kock MD, Young KB (1994) Hepatopathy in two black rhinoceroses (Diceros bicornis) in Zimbabwe: creosote toxicosis. Journal of Zoo and Wildlife Medicine, 25(2):270–273.
Koepfler E, Kator H (1986) Ecotoxicological effects of creosote contamination in benthic microbial populations in an estuarine environment. Toxicity Assessment: An International Journal, 1:465–485.
Koganti A, Spina D, Rozett K (1998) Studies on the applicability of biomarkers in estimating the systemic availability of polynuclear aromatic hydrocarbons from manufactured gas plant tar-contaminated soils. Environmental Science and Technology, 32:3104–3112.
Kohler M, Künniger T, Schmid P, Gujer E, Crockett R, Wolfensberger M (2000) Inventory and emission factors of creosote, polycyclic aromatic hydrocarbons (PAHs) and phenols from railroad ties treated with creosote. Environmental Science and Technology, 34(22):4766–4772.
Krahn MM, Rhodes LD, Myers MS, Moore LK, MacLeod WD, Malins DC (1986) Associations between metabolites of aromatic compounds in bile and the occurrence of hepatic lesions in English sole (Parophrys vetulus) from Puget Sound, Washington. Archives of Environmental Contamination and Toxicology, 15:61–67.
Krone C, Burrows DG, Brown DW, Robisch PA, Friedman AJ, Malins D (1986) Nitrogen-containing aromatic compounds in sediments from a polluted harbor in Puget Sound. Environmental Science and Technology, 20:1144–1150.
Kuhn E, Suflita J (1989) Microbial degradation of nitrogen, oxygen and sulfur heterocyclic compounds under anaerobic conditions: studies with aquifer samples. Environmental Toxicology and Chemistry, 8:1149–1158.
Kuljukka T, Vaaranrinta R, Veidebaum T, Sorsa M, Peltonen K (1996) Exposure to PAH compounds among cokery workers in the oil shale industry. Environmental Health Perspectives, 104(Suppl. 3):539–541.
Lantz S, Montgomery M, Schultz W, Pritchard P, Spargo B, Müller J (1997) Constituents of an organic wood preservative that inhibit the fluoranthene-degrading activity of Sphingomonas paucimobilis strain EPA505. Environmental Science and Technology, 31(12):3573–3580.
Later DW, Lee ML, Bartle K, Kong R, Vassilaros D (1981) Chemical class separation and characterization of organic compounds in synthetic fuels. Analytical Chemistry, 53:1612–1620.
La Voie EJ, Dolan S, Little P, Wang C-X, Sugie S, Rivenson A (1988) Carcinogenicity of quinoline, 4- and 8-methylquinoline and benzoquinolines in newborn mice and rats. Food and Chemical Toxicology, 26(7):625–629.
Leadon S, Sumerel J, Minton T, Tischler A (1995) Coal tar residues produce both DNA adducts and oxidative DNA damage in human mammary epithelial cells. Carcinogenesis, 16(12):3021–3026.
Leblond J, Schultz T, Sayler G (2001) Observations on the preferential biodegradation of selected components of polyaromatic hydrocarbon mixtures. Chemosphere, 42:333–343.
Lee M, Ward C (1985) Microbial ecology of a hazardous waste disposal site: enhancement of biodegradation. In: Proceedings of the 2nd international conference on ground water quality research, Tulsa, OK, March 1984. Stillwater, OK, OSU Printing Services, pp. 25–27.
Lehto KM, Lemmetyinen H, Puhakka J (2000) Biodegradation of photoirradiated polycyclic aromatic hydrocarbon constituents of creosote oil. Environmental Technology, 21(8):901–907.
Lenson N (1956) Multiple cutaneous carcinoma after creosote exposure. New England Journal of Medicine, 254:520–522.
Leo A, Hansch C, Elkins D (1971) Partition coefficients and their uses. Chemical Reviews, 71:525–616.
Lewin L (1929) Gifte und Vergiftungen. Berlin, Stilke [cited in Allan, 1994].
Lewtas J, Walsh D, Williams R, Dobias L (1997) Air pollution exposure–DNA adduct dosimetry in humans and rodents: evidence for non-linearity at high doses. Mutation Research, 378:51–63.
Licht D, Ahring B, Arvin E (1996) Effects of electron acceptors, reducing agents, and toxic metabolites on anaerobic degradation of heterocyclic compounds. Biodegradation, 7:83–90.
Licht D, Johansen S, Arvin E, Ahring B (1997) Transformation of indole and quinoline by Desulfobacterium indolicum (DSM 3383). Applied Microbiology and Biotechnology, 47:167–172.
Lijinsky W, Saffiotti U, Shubik P (1957) A study of the chemical constitution and carcinogenic actions of creosote oil. Journal of the National Cancer Institute, 18:687–692.
Linder G, Bergman H, Meyer J (1985) Anthracene bioconcentration in rainbow trout during single-compound and complex-mixture exposures. Environmental Toxicology and Chemistry, 4:549–558.
Londry K, Suflita J (1998) Toxicity effects of organosulfur compounds on anaerobic microbial metabolism. Environmental Toxicology and Chemistry, 17(7):1199–1206.
Lorenz LF, Gjovik LR (1972) Analysing creosote by gas chromatography: relationship to creosote specifications. Proceedings of the Annual Meeting of the American Wood-Preservers’ Association, 68: 32–42.
Lotfabad SK, Gray MR (2002) Kinetics of biodegradation of mixtures of polycyclic aromatic hydrocarbons. Applied Microbiology and Biotechnology, 60(3):361–366.
Lu C, Li AP (2001) Species comparison in P450 induction: effects of dexamethasone, omeprazol and rifampicin on P450 isoforms 1A and 3A in primary cultured hepatocytes from man, Sprague-Dawley rat, minipig and beagle dog. Chemistry & Biology, 134:271–281.
Lu P, Metcalf R, Carlson E (1978) Environmental fate of five radiolabeled coal conversion by-products evaluated in a laboratory model ecosystem. Environmental Health Perspectives, 24:201–208.
Luukkanen L, Elovaara E, Lautala P, Taskinen J, Vainio H (1997) Characterization of 1-hydroxypyrene as a novel marker substrate of 3-methylcholanthrene-inducible phenol UDP-glucuronosyltransferase(s). Pharmacology & Toxicology, 80:152–158.
Lyons B, Harvey J, Parry J (1997) An initial assessment of the genotoxic impact of the Sea Empress oil spill by the measurement of DNA adduct levels in the intertidal teleost Lipophrys pholis. Mutation Research, 390(3):263–268.
Mackay D, Shiu WY (1977) Aqueous solubility of polynuclear aromatic hydrocarbons. Journal of Chemical Engineering Data, 22:399–402.
Mackay D, Bobra A, Chan DW, Shiu WY (1982) Vapor pressure correlations for low-volatility environmental chemicals. Environmental Science and Technology, 16:645–649.
Mackay D, Shiu WY, Maijanen A, Feenstra S (1991) Dissolution of non-aqueous phase liquids in groundwater. Journal of Contaminant Hydrology, 8:23–42.
Mackenzie S (1898) Yellow pigmentary stains of hemorrhagic origin and a case of tar eruption. British Journal of Dermatology, 10:416–417.
Maddy KT, Edmiston S, Richmond D (1990) Illness, injuries, and deaths from pesticide exposures in California 1949–1988. Reviews of Environmental Contamination and Toxicology, 14:57–123.
Mahaffey W, Sanford R, Strehler A, Bourquin A (1989) Biological treatment of groundwater contaminated with creosote and pentachlorophenol. Abstracts of the Annual Meeting of the American Society for Microbiology, 89:338.
Mahlum DD (1983) Initiation/promotion studies with coal-derived liquids. Journal of Applied Toxicology, 3:31–34.
Mahlum DD, Wright CW, Chess EK, Wilson BW (1984) Fractionation of skin tumor-initiating activity of coal liquids. Cancer Research, 44:5176–5181.
Mäkinen R, Korhonen K (1983) [Workplace air measurements in a railway switch assembly shop and in construction of rails.] Lappeenranta, Finnish Institute of Occupational Health, Regional Institute of Lappeenranta, January (in Finnish) [cited in Heikkilä, 2001].
Malins D, Roubal W (1985) Free radicals derived from nitrogen- containing xenobiotics in sediments and liver and bile of English sole from Puget Sound, Washington. Marine Environmental Research, 17:205–210.
Malins D, McCain B, Brown D, Chan S-L, Myers M, Landahl J, Prohaska P, Friedman A, Rhodes L (1984) Chemical pollutants in sediments and diseases of bottom-dwelling fish in Puget Sound, Washington. Environmental Science and Technology, 18:705–713.
Malins D, Krahn M, Myers M, Rhodes L, Brown D, Krone C, McCain B, Chan S (1985) Toxic chemicals in sediment and biota from a creosote-polluted harbor: relationships with hepatic neoplasms and other hepatic lesions in English sole (Parophrys vetulus). Carcinogenesis, 6(10):1463–1469.
Mangelsdorf I, Boehncke A, Holländer W (1998) Evaluation of a dermal carcinogenicity study with mice with two different creosotes. Prepared by the Fraunhofer Institute of Toxicology and Aerosol Research for the German Federal Ministry of Environment, Nature Conservation and Nuclear Safety, based on a dermal carcinogenicity study conducted for Rütgers-VfT AG, Duisburg, 27 pp.
Markel HL Jr, Ligo RN, Lucas JB (1977) Health hazard evaluation/toxicity determination report. North Little Rock, AK, Koppers Company, Inc., pp. 1–15 (75-117-372).
Martin J, Imbernon E, Goldberg M, Chevalier A, Bonenfant S (2000) Occupational risk factors for lung cancer in the French electricity and gas industry: a case–control survey nested in a cohort of active employees. American Journal of Epidemiology, 151(9):902–912.
Marutzky R (1990) Entsorgung von mit Holzschutzmitteln behandelten Hölzern - Möglichkeiten und Probleme. Holz als Roh- und Werkstoff, 48:19–24.
Marwood CA, Solomon KR, Greenberg G (2001) Chlorophyll fluorescence as a bioindicator of effects on growth in aquatic macrophytes from mixtures of polycyclic aromatic hydrocarbons. Environmental Toxicology and Chemistry, 20(4):890–898.
McCann J, Solomon K (2000) The effect of creosote on membrane ion leakage in Myriophyllum spicatum L. Aquatic Toxicology, 50(3):275–284.
McCann J, Greenberg G, Solomon K (2000) The effect of creosote on the growth of an axenic culture of Myriophyllum spicatum L. Aquatic Toxicology, 50(3):265–276.
McGlynn SE, Livingston RJ (1997) The distribution of polynuclear aromatic hydrocarbons between aquatic plants and sediments. International Journal of Quantum Chemistry, 64:271–283.
McKee P, Burt A, McCurvin D (1990) Levels of dioxins, furans and other organic contaminants in harbour sediments near a wood preserving plant using pentachlorophenol and creosote. Chemosphere, 20:1679–1685.
McLeese D, Metcalfe C (1979) Toxicity of creosote to larval and adult lobster and Crangon and its accumulation in lobster hepatopancreas. Bulletin of Environmental Contamination and Toxicology, 22:796–799.
Meador J, Stein J, Reichert W, Varanasi U (1995) Bioaccumulation of polycyclic aromatic hydrocarbons by marine organisms. Reviews of Environmental Contamination and Toxicology, 143:79–165.
Merlescu G (1974) Toxidermies cutanées chez les ouvriers de chemin de fer. Schweizerische Rundschau für Medizin Praxis, 63:902–904.
Merrill E, Wade T (1985) Carbonized coal products as a source of aromatic hydrocarbons to sediments from a highly industrialized estuary. Environmental Science and Technology, 19(7):597–603.
Metcalfe JL, Hayton A (1989) Comparison of leeches and mussels as biomonitors for chlorophenol pollution. Journal of Great Lakes Research, 15(4):654–668.
Meyer J, Di Giulio R (2002) Patterns of heritability of decreased EROD activity and resistance to PCB 126-induced teratogenesis in laboratory-reared offspring of killifish (Fundulus heteroclitus) from a creosote-contaminated site in the Elizabeth River, VA, USA. Marine Environmental Research, 54(3–5):621–626.
Meyer JN, Nacci DE, Di Giulio RT (2002) Cytochrome P4501A (CYP1A) in killifish (Fundulus heteroclitus): heritability of altered expression and relationship to survival in contaminated sediments. Toxicological Sciences, 68(1):69–81.
Micklewright JT (1998) Wood preservation statistics: 1997. A report to the wood preserving industry in the United States. Selma, AL, American Wood-Preservers’ Association.
Middaugh D, Mueller J, Thomas R, Lantz S, Hemmer M, Brooks G, Chapman P (1991) Detoxification of pentachlorophenol and creosote contaminated groundwater by physical extraction: chemical and biological assessment. Archives of Environmental Contamination and Toxicology, 21:233–244.
Middaugh D, Thomas R, Lantz S, Heard C, Mueller J (1994a) Field scale testing of a hyperfiltration unit for removal of creosote and pentachlorophenol from ground water: Chemical and biological assessment. Archives of Environmental Contamination and Toxicology, 26:309–319.
Middaugh D, Lantz S, Heard C, Mueller J (1994b) Field scale testing of a two-stage bioreactor for removal of creosote and pentachlorophenol from ground water: chemical and biological assessment. Archives of Environmental Contamination and Toxicology, 26:320–328.
Miller C, Comalander D (1988) Groundwater quality. Journal of the Water Pollution Control Federation, 60(6):961–978.
Miller D (1977) Loss of creosote from Douglas-fir marine piles. Forest Products Journal, 27:28–33.
Miller R, Singer G, Rosen J, Bartha R (1988) Photolysis primes biodegradation of benzo[a]pyrene. Applied Environmental Microbiology, 54(7):1724–1730.
Millette D, Barker J, Comeau Y, Butler B, Frind E, Clement B, Samson R (1995) Substrate interaction of creosote-related compounds: a factorial batch experiment. Environmental Science and Technology, 29:1944–1952.
Millette D, Butler B, Frind E, Comeau Y, Samon R (1998) Substrate interaction during aerobic biodegradation of creosote-related compounds in columns of sandy aquifer material. Journal of Contaminant Hydrology, 29(2):163–181.
Mohammed S, Sorensen D, Sims D (1998) Pentachlorophenol and phenanthrene biodegradation in creosote contaminated aquifer material. Chemosphere, 37(1):103–111.
Moody R, Nadeau B, Chu I (1995) In vivo and in vitro dermal absorption of benzo[a]pyrene in rat, guinea pig, human and tissue-cultured skin. Journal of Dermatological Science, 9:48–58.
Morita T, Asano N, Awogi T, Sasaki Y, Sato S, Shimada H, Sutou S, Suzuki T, Wakata A, Sofuni T, Hayashi M (1997) Evaluation of the rodent micronucleus assay in the screening of IARC carcinogens (groups 1, 2A and 2B): the summary report of the 6th collaborative study by CSGMT/JEMS MMS. Collaborative study of the micronucleus group test. Mammalian mutagenicity study group. Mutation Research, 389(1):3–122.
Mothershead R, Hale R (1992) Influence of ecdysis on the accumulation of polycyclic aromatic hydrocarbons in field exposed blue crabs (Callinectes sapidus). Marine Environmental Research, 33(2):145–156.
Motohashi N, Kamata K, Meyer R (1991) Chromatographic separation and determination of carcinogenic benz(c)acridine in creosote oils. Environmental Science and Technology, 25(5):342–346.
Mueller J, Chapman P, Pritchard P (1989) Action of a fluoranthene-utilizing bacterial community on polycyclic aromatic hydrocarbon components of creosote. Applied Environmental Microbiology, 55(12):3085–3090.
Mueller J, Middaugh D, Lantz S, Chapman P (1991a) Biodegradation of creosote and pentachlorophenol in contaminated groundwater: Chemical and biological assessment. Applied Environmental Microbiology, 57:1277–1285.
Mueller J, Lantz S, Blattmann B, Chapman P (1991b) Bench- scale evaluation of alternative biological treatment processes for the remediation of pentachlorophenol- and creosote- contaminated materials: solid-phase bioremediation. Environmental Science and Technology, 25:1045–1055.
Mueller J, Lantz S, Blattmann B, Chapman P (1991c) Bench-scale evaluation of alternative biological treatment processes for the remediation of pentachlorophenol- and creosote- contaminated materials: slurry-phase bioremediation. Environmental Science and Technology, 25:1055–1061.
Mueller J, Lantz S, Ross D, Colvin R, Middaugh D, Pritchard P (1993) Strategy using bioreactors and specially selected microorganisms for bioremediation of groundwater contaminated with creosote and pentachlorophenol. Environmental Science and Technology, 27:691–698.
Mueller J, Cerniglia C, Pritchard P (1996) Bioremediation of environments contaminated by polycyclic aromatic hydrocarbon. In: Crawford R, Crawford D, eds. Bioremediation, principles and applications. Cambridge, Cambridge University Press, pp. 125–194 (Biotechnology Research Series).
Mukhtar H, Asokan P, Das M, Santella R, Bickers D (1986) Benzo(a)pyrene diol epoxide-I-DNA adduct formation in the epidermis and lung of SENCAR mice following topical application of crude coal tar. Cancer Letters, 33:287–294.
Nestler FM (1974) Characterization of wood-preserving coal-tar creosote by gas–liquid chromatography. Analytical Chemistry, 46:46–53.
Nielsen P, Christensen T (1994) Variability of biological degradation of phenolic hydrocarbons in an aerobic aquifer determined by laboratory batch experiments. Journal of Contaminant Hydrology, 17:55–67.
NIOSH (1980) Industrial hygiene report, comprehensive survey of wood preservative treatment facility at Santa Fe Centralized Tie Plant, Somerville, Texas. Cincinnati, OH, US Department of Health and Human Services, National Institute for Occupational Safety and Health, Division of Surveillance, Hazard Evaluations and Field Studies (IWS-110.20).
NIOSH (1981a) Health hazard evaluation: New York Port Authority, Brooklyn, New York. Cincinnati, OH, US Department of Health and Human Services, National Institute for Occupational Safety and Health (HHE 80-238-931).
NIOSH (1981b) Industrial hygiene report, comprehensive survey of wood preservative treatment facility at Cascade Pole Company, McFarland Cascade, Tacoma, Washington. Cincinnati, OH, US Department of Health and Human Services, National Institute for Occupational Safety and Health (NTIS PB82-174160).
NIOSH (1998) Benzene soluble fraction and total particulate (asphalt fume): Method 5042. In: Eller PM, Cassinelli ME, eds. NIOSH manual of analytical methods, 4th ed., 2nd supplement. Cincinnati, OH, US Department of Health and Human Services, National Institute for Occupational Safety and Health (DHHS (NIOSH) 98-119).
NRCC (1983) Polycyclic aromatic hydrocarbons in the aquatic environment: formation, sources, fate and effects on aquatic biota. Ottawa, Ontario, National Research Council of Canada, Associate Committee on Scientific Criteria for Environmental Quality, pp. 1–209 (NRCC No. 18981).
Nurmi A (1990) Leachability of active ingedients from some CCA treated and creosoted poles in service — a progress report after 10 years testing. Stockholm, The International Research Group on Wood Protection.
Nylund L, Heikkilä P, Hesso A, Hämaila M, Linainmaa K, Sorsa M, Romo M (1989) [Genotoxicity of creosotes.] Helsinki, Finnish Institute of Occupational Health and the Finnish State Railways (in Finnish) [cited in Heikkilä, 2001].
Nylund L, Heikkila P, Hameila M, Pyy L, Linnainmaa K, Sorsa M (1992) Genotoxic effects and chemical compositions of four creosotes. Mutation Research, 265:223–236.
O’Donovan W (1920) Epitheliomatous ulceration among tar workers. British Journal of Dermatology and Syphilis, 32:215–252.
Oehme F, Barrett D (1986) Veterinary gastrointestinal toxicology. In: Rozman K, Hanninen O, eds. Gastrointestinal toxicology. Amsterdam, Elsevier, pp. 464–513.
Olafson P, Leutritz J (1959) The toxicity of creosote and creosote–pentachlorophenol mixtures to cattle. Proceedings of the Annual Meeting of the American Wood-Preservers’ Association, 55:54–57.
Ondrus M, Steinheimer T (1990) High-performance liquid chromatographic determination of azaarenes and their metabolites in groundwater affected by creosote wood preservatives. Journal of Chromatographic Science, 28:324–330.
OSHA (1986) Coal tar pitch volatiles (CTPV), coke oven emissions (COE), selected polynuclear aromatic hydrocarbons (PAHs): OSHA Method 58. Salt Lake City, UT, US Department of Labor, Occupational Safety and Health Administration, pp. 1–31. Available at http://www.osha.gov/dts/sltc/methods/organic/org058/org058.html.
Otte M, Gagnon J, Comeau Y, Matte N, Greer C, Samson R (1994) Activation of an indigenous microbial consortium for bioaugmentation of pentachlorophenol/creosote contaminated soils. Applied Microbiology and Biotechnology, 40:926–932.
Ownby DR, Newman MC, Mulvey M, Vogelbein WK, Unger MA, Arzayus LF (2002) Fish (Fundulus heteroclitus) populations with different exposure histories differ in tolerance of creosote-contaminated sediments. Environmental Toxicology and Chemistry, 21(9):1897–1902.
Padma TV, Hale RC, Roberts MH (1998) Toxicity of water-soluble fractions derived from whole creosote and creosote-contaminated sediments. Environmental Toxicology and Chemistry, 17(8):1606–1610.
Padma TV, Hale RC, Roberts MH, Lipcius R (1999) Toxicity of creosote water-soluble fractions generated from contaminated sediments to the bay mysid. Ecotoxicology and Environmental Safety, 42(2):171–176.
Pastorok RA, Peek DC, Sampson JR, Jacobson MA (1994) Ecological risk assessment for river sediments contaminated by creosote. Environmental Toxicology and Chemistry, 13(12):1929–1941.
Pereira WE, Rostad CE (1986) Investigations of organic contaminants derived from wood-treatment processes in a sand and gravel aquifer near Pensacola, Florida. US Geological Survey Water Supply Paper, 2290:65–80.
Pereira WE, Rostad CE, Garbarino J, Hult M (1983) Groundwater contamination by organic bases derived from coal-tar wastes. Environmental Toxicology and Chemistry, 2:283–294.
Pereira WE, Rostad CE, Updegraff DL, Bennett JM (1987) Fate and movement of azaarenes and their anaerobic biotransformation products in an aquifer contaminated by wood-treatment chemicals. Environmental Toxicology and Chemistry, 6:163–176.
Pereira W, Rostad C, Leiker T, Updegraff D, Bennett J (1988) Microbial hydroxylation of quinoline in contaminated groundwater: evidence for incorporation of the oxygen atom of water. Applied Environmental Microbiology, 54(3):827–829.
Persson B, Dahlander A, Fredriksson M, Brage H, Ohlson C, Axelson O (1989) Malignant lymphomas and occupational exposures. British Journal of Industrial Medicine, 46:516–520.
Persson B, Fredriksson M, Olsen K, Boeryd B, Axelson O (1993) Some occupational exposures as risk factors for malignant lymphomas. Cancer, 72(5):1773–1778.
Petrowitz H-J, Becker G (1964) Untersuchungen über die chemische Zusammensetzung von Steinkohlenteeröl in verschiedenen lange benutzten Buchen- und Kiefernschwellen. Materialprüfung, 6:461–470.
Petrowitz H, Becker G (1965) Untersuchungen über chemische Veränderungen von Steinkohlenteeröl in Buchen und Kiefernholz. Materialprüfung, 7:325–330.
Pfitzer EA, Gross P, Kaschak M (1965) Range-finding toxicity tests on creosote (64-451B) for Koppers Company, Inc. Pittsburgh, PA, Industrial Hygiene Foundation of America, Inc., Mellon Institute (unpublished report) [cited in von Burg & Stout, 1992].
Phillips D, Schoket B, Hewer A, Grover P (1990a) DNA adduct formation in human and mouse skin by mixtures of polycyclic aromatic hydrocarbons. IARC Scientific Publications, 104:223–230.
Phillips D, Schoket B, Hewer A, Grover P (1990b) Human DNA adducts due to smoking and other exposures to carcinogens. In: Mendelsohn ML, Albertini RJ, eds. Mutation and the environment: Proceedings of the fifth international conference on environmental mutagens, Cleveland, OH ,10–15 July 1989. New York, NY, Wiley-Liss, pp. 283–292.
Pittinger C, Buikema AJ, Hornor S, Young R (1985) Variation in tissue burdens of polycyclic aromatic hydrocarbons in indigenous and relocated oysters. Environmental Toxicology and Chemistry, 4:379–387.
Poel W, Kammer A (1957) Experimental carcinogenicity of coal tar fractions: The carcinogenicity of creosote oils. Journal of the National Cancer Institute Monographs, 18:41–55.
Pollard ST, Hrudey S, Fedorak P (1994) Bioremediation of petroeum- and creosote-contaminated soils: A review of constraints. Waste Management & Research, 12:173–194.
Powell N, Sayce C, Tufts D (1970) Hyperplasia in an estuarine bryozoan attributable to coal tar derivates. Journal of the Fisheries Research Board of Canada, 27:2095–2098.
Preston-Mafham J, Boddy L, Randerson PF (2002) Analysis of microbial community functional diversity using sole carbon source utilisation profiles — a critique. FEMS Microbiology Ecology, 42:1–14.
Priddle M, MacQuarrie K (1994) Dissolution of creosote in groundwater: an experimental and modeling investigation. Journal of Contaminant Hydrology, 15:27–56.
Priha E, Ahonen I, Oksa P (2001) Control of chemical risk during the treatment of soil contaminated with chlorophenol, creosote and copper-chrome-arsenic wood preservatives. American Journal of Industrial Medicine, 39(4):402–409.
Pukkala E (1995) Cancer risk by social class and occupation: A survey of 109,000 cancer cases among Finns of working age. Basel, Karger, pp. 1–277.
Quinlan R, Kowalczyk G, Gardiner K, Calvert I, Hale K, Walton S (1995) Polycyclic aromatic hydrocarbon exposure in coal liquefaction workers: the value of urinary 1-hydroxypyrene excretion in the development of occupational hygiene control strategies. Annals of Occupational Hygiene, 39(3):329–346.
Randerath E, Zhou G, Donnelly K, Safe S, Randerath K (1996) DNA damage induced in mouse tissues by organic wood preserving waste extracts as assayed by 32P-postlabeling. Archives of Toxicology, 70(11):683–695.
Rasmussen G, Fremmersvik G, Olsen RA (2002) Treatment of creosote-contaminated groundwater in a peat/sand permeable barrier — a column study. Journal of Hazardous Materials, B93:285–306.
Raven KG, Beck P (1992) Coal tar and creosote contamination in Ontario. In: Weyer KU, ed. Subsurface contamination by immiscible fluids: Proceedings of the international conference on subsurface contamination by immiscible fluids, Calgary, Alberta, 18–20 April 1990. Rotterdam, Balkema, pp. 401–410.
Reddy M, Blackburn GR, Schreiner CA, Mackerer CR (1997) Correlation of mutagenic potencies of various petroleum oils and oil coal tar mixtures with DNA adduct levels in vitro. Mutation Research, 378:89–95.
Reichert WL, Myers MS, Peck-Miller K, French B, Anulcion BF, Collier TK, Stein JE, Varanasi U (1998) Molecular epizootiology of genotoxic events in marine fish: linking contaminant exposure, DNA damage, and tissue-level alterations. Mutation Research, 411(3):215–225.
Reid BJ, Jones KC, Semple KT (2000) Bioavailability of persistent organic pollutants in soils and sediments — a perspective on mechanisms, consequences and assessment. Environmental Pollution, 108:103–112.
Ren L, Huang X, McConkey B, Dixon D, Greenberg B (1994) Photoinduced toxicity of three polycyclic aromatic hydrocarbons (fluoranthene, pyrene, and naphthalene) to the duckweed Lemna gibba L G3. Ecotoxicology and Environmental Safety, 28:160–171.
Rippen G (1999) Handbuch Umweltchemikalien. - Stoffdaten, Prüfverfahren, Vorschriften. 49. Ergänzungslieferung. Landsberg/Lech, Ecomed.
Roberts M, Hargis W, Strobel C, DeLisle P (1989) Acute toxicity of PAH contaminated sediments to the estuarine fish, Leiostomus xanthurus. Bulletin of Environmental Contamination and Toxicology, 42:142–149.
Roe FC, Bosch D, Boutwell R (1958) The carcinogenicity of creosote oil: the induction of lung tumors in mice. Cancer Research, 18:1176–1178.
Roggeband R, Van Den Berg P, Steenwinkel M, Baan R, Van Der Wulp C (1991) Biomonitoring of occupational exposure to PAH through analysis of DNA adducts in human white blood cells by quantitative immunofluorescence microscopy and 32P-postlabelling. Mutation Research, 252:219–220.
Roos PH, van Afferden M, Strotkamp D, Tappe D, Pfeifer F, Hanstein WG (1996) Liver microsomal levels of cytochrome P4501A1 as biomarker for exposure and bioavailability of soil-bound polycyclic aromatic hydrocarbons. Archives of Contamination and Toxicology, 30:107–113.
Roos PH, Tschirbs S, Welge P, Hack A, Theegarten D, Mogilevski G, Wilhelm M (2002) Induction of cytochrome P4501A1 in multiple organs of minipigs after oral exposure to soils contaminated with polycyclic aromatic hydrocarbons. Archives of Toxicology, 76:326–334.
Rose WL, French BL, Reichert WL, Faisal M (2000) DNA adducts in hematopoietic tissues and blood of the mummichog (Fundulus heteroclitus) from a creosote-contaminated site in the Elizabeth River, Virginia. Marine Environmental Research, 50(1–5):581–589.
Rosenfeld JK, Plumb RH (1991) Ground water contamination at wood treatment facilities. Ground Water Monitoring and Review, 11(1):133–140.
Rostad C, Pereira W (1987) Creosote compounds in snails obtained from Pensacola Bay, Florida (USA), near an onshore hazardous-waste site. Chemosphere, 16(10–12):2397–2404.
Rostad C, Pereira W, Ratcliff S (1984) Bonded-phase extraction column isolation of organic compounds in groundwater at a hazardous waste site. Analytical Chemistry, 56:2856–2860.
Rostad C, Pereira W, Hult M (1985) Partitioning studies of coal-tar constituents in a two-phase contaminated ground-water system. Chemosphere, 14(8):1023–1036.
Rotard W, Mailahn W (1987) Gas chromatographic–mass spectrometric analysis of creosotes extracted from wooden sleepers installed in playgrounds. Analytical Chemistry, 59:65–69.
Rothenburger S, Atlas R (1990) Mixed aerobic culture biodegradation of creosote. Abstracts of the Annual Meeting of the American Society for Microbiology, 90:308.
Roy TA, Blackburn GR, Mackerer CR (1996) Evaluation of physicochemical factors affecting dermal penetration and carcinogenic potency of mineral oils containing polycyclic aromatic compounds. Polycyclic Aromatic Compounds, 10:333–342.
RPA (2000) Analysis on the advantages and drawbacks of restrictions on the marketing and use of creosote. Prepared by Risk & Policy Analysts Ltd for European Commission, Directorate-General Enterprise, pp. 1–70 (ETD/99/502499).
RTECS (1999) Coal-tar-creosote — CAS-No.
Rudling J, Rosen G (1983) Kemiska hälsorisker vid träimpregnering II. Stockholm, Arbetarskyddsstyrelsen (Report No. Undersökningsrapport 1983:11) [cited in Heikkilä, 2001].
Sall R, Shear M (1940) Studies in carcinogenesis. XII. Effect of the basic fraction of creosote oil on the production of tumors in mice by chemical carcinogens. Journal of the National Cancer Institute, 1:45–55.
Sandell E, Tuominen J (1996) The impact of the use and disposal of creosote impregnated railway ties on a freshwater supply area in southern Finland. Polycyclic Aromatic Compounds, 11:83–90.
Sanner T, Rivedal E (1988) Mechanisms of transformation and promotion of Syrian hamster embryo cells. In: Langenbach R, Barret JC, Elmore E, Promoters T, eds. Tumor promoters: Biological approaches for mechanistic studies and assay systems. New York, NY, Raven Press, pp. 187–200.
Sartorelli P, Cenni A, Matteucci G, Montomoli L, Novelli M, Palmi S (1999) Dermal exposure assessment of polycyclic aromatic hydrocarbons: in vitro percutaneous penetration from lubricating oil. International Archives of Occupational and Environmental Health, 72(8):528–532.
Sasson-Brickson G, Burton RJ (1991) In situ laboratory sediment toxicity testing with Ceriodaphnia dubia. Environmental Toxicology and Chemistry, 10(2):201–208.
Saunders CR, Ramesh A, Shockley DC (2002) Modulation of neurotoxic behaviour in F-344 rats by temporal disposition of benzo[a]pyrene. Toxicology Letters, 129:33–45.
Savitz D, Whelan E, Kleckner R (1989) Effect of parents’ occupational exposures on risk of stillbirth, preterm delivery and small-for-gestational-age infants. American Journal of Epidemiology, 129(6):1201–1218.
Schildt E, Eriksson M, Hardell L, Magnuson A (1999) Occupational exposures as risk factors for oral cancer evaluated in a Swedish case–control study. Oncology Reports, 6(2):317–320.
Schirmberg R (1980) [The concentration of polycyclic aromatic compounds in some creosotes.] Analytical report to the Finnish Wood Preservers’ Association. Helsinki, Finnish Institute of Occupational Health (in Finnish) [cited in Heikkilä, 2001].
Schipper I (1961) Toxicity of wood preservatives for swine. American Journal of Veterinary Research, 22:401–405.
Schirmer K, Herbrick JS, Greenberg B, Dixon D, Bols N (1999) Use of fish gill cells in culture to evaluate the cytotoxicity and photocytotoxicity of intact and photomodified creosote. Environmental Toxicology and Chemistry, 18(6):1277–1288.
Schoket B, Hewer A, Grover P, Phillips D (1988a) Covalent binding of components of coal-tar, creosote and bitumen to the DNA of the skin and lungs of mice following topical application. Carcinogenesis, 9:1253–1258.
Schoket B, Hewer A, Grover P, Phillips D (1988b) Formation of DNA adducts in human skin maintained in short-term organ culture and treated with coal-tar, creosote or bitumen. International Journal of Cancer, 42:622–626.
Schoor W, Williams D, Takahashi N (1991) The induction of cytochrome P-450-IA1 in juvenile fish by creosote-contaminated sediment. Archives of Environmental Contamination and Toxicology, 20(4):497–504.
Schwartz L (1942) Dermatitis from creosote treated wooden floors. Industrial Medicine, 11(8):387.
Seeley K, Weeks-Perkins B (1991) Altered phagocytic activity of macrophages in oyster toadfish from a highly polluted subestuary. Journal of Aquatic Animal Health, 3:224–227.
Selifonov S, Chapman P, Akkerman S (1998) Use of 13C nuclear magnetic resonance to assess fossil fuel biodegradation: fate of [1-13C] acenaphthene in creosote polycyclic aromatic compound mixtures degraded by bacteria. Applied Environmental Microbiology, 64(4):1447–1453.
Serpone N, Terzian R, Lawless D, Pelletier A-M, Minero C, Pelizzetti E (1994) Photocatalyzed destruction of water contaminants: Mineralization of aquatic creosote phenolics and creosote by irradiated particulates of the white paint pigment titania. In: Helz G, ed. Aquatic and surface photochemistry. Boca Raton, FL, Lewis Publishers, pp. 387–398.
Sharak Genthner B, Townsend G, Lantz S, Mueller J (1997) Persistence of polycyclic aromatic hydrocarbon components of creosote under anaerobic enrichment conditions. Archives of Environmental Contamination and Toxicology, 32(1):99–105.
Shimkin M, Koe B, Zechmeister L (1951) An instance of the occurrence of carcinogenic substances in certain barnacles. Science, 113:650–651.
Shiu WY, Maijanen A, Ng ALY, Mackay D (1988) Preparation of aqueous solutions of sparingly soluble organic substances: II. Multicomponent systems — hydrocarbon mixtures and petroleum products. Environmental Toxicology and Chemistry, 7:125–137.
Sibley P, Harris M, Bestari K, Steele T, Robinson R, Gensemer R, Day K, Solomon K (2001a) Response of zooplankton communities to liquid creosote in freshwater microcosms. Environmental Toxicology and Chemistry, 20(2):394–405.
Sibley PK, Harris ML, Bestari KT, Steele TA, Robinson RD, Gensemer RW, Day KE, Solomon KR (2001b) Response of phytoplankton communities to liquid creosote in freshwater microcosms. Environmental Toxicology and Chemistry, 20(12):2785–2793.
Siemiatycki J, Dewar R, Nadon L, Gerin M (1994) Occupational risk factors for bladder cancer: results from a case–control study in Montreal, Quebec, Canada. American Journal of Epidemiology, 140(12):1061–1080.
Simmon VF, Poole DC (1978) In vitro microbiological mutagenicity assays of creosote P1 and P2. Report prepared by SRI International for US Environmental Protection Agency (Contract No. 68-01-2458). Cited in Federal Register, 43(202):48154–48214 [cited in IARC, 1985].
Singleton I (1994) Microbial metabolism of xenobiotics: fundamental and applied research. Journal of Chemical Technology and Biotechnology, 59:9–23.
Slooff W, Janus JA, Matthijsen AJCM, Montizaan GK, Ros JPM (1989) Integrated criteria document: PAHs. Bilthoven, National Institute of Public Health and Environmental Protection, 200 pp.
Smith E, Hammonds-Ehlers M, Clark M, Kirchner H, Fourtes L (1997) Occupational exposures and risk of female infertility. Journal of Occupational and Environmental Medicine, 39(2):138–147.
Southworth GR, Beauchamp JJ, Schmieder PK (1978) Bioaccumulation potential of polycyclic aromatic hydrocarbons in Daphnia pulex. Water Research, 12:973–977.
Southworth GR, Keffer CC, Beauchamp JJ (1980) Potential and realized bioconcentration. A comparision of observed and predicted bioconcentrations of azaarenes in fathead minnow (Pimephales promelas). Environmental Science and Technology, 14:1529–1531.
Springer D, Mann D, Dankovic D, Thomas B, Wright C, Mahlum D (1989) Influences of complex organic mixtures on tumor-initiating activity, DNA binding and adducts of benzo(a)pyrene. Carcinogenesis, 10:131–137.
Steineck G, Plato N, Alfredsson L, Norell S (1989) Industry-related urothelial carcinogens: Application of a job-exposure matrix to census data. American Journal of Industrial Medicine, 16(2):209–224.
Sundström G, Larsson A, Tarkpea M (1986) Creosote. In: Hutzinger O, ed. Environmental chemistry. Vol. 3, Part D: Anthropogenic compounds. Berlin, Springer-Verlag, pp. 159–205.
Sved D, Roberts H (1995) A novel use for the continuous-flow serial diluter: aquatic toxicity testing of contaminated sediments in suspension. Water Research, 29(4):1169–1177.
Sved D, Van Veld P, Roberts MJ (1992) Hepatic EROD activity in spot, Leiostomus xanthurus, exposed to creosote-contaminated sediments. Marine Environmental Research, 34:189–193.
Sved DW, Roberts MH, Van Veld PA (1997) Toxicity of sediments contaminated with fractions of creosote. Water Research, 31(2):294–300.
Swartz R, Kemp P, Schults D, Ditsworth G, Ozretich R (1989) Acute toxicity of sediment from Eagle Harbor, Washington (USA), to the infaunal amphipod Rhepoxynius. Environmental Toxicology and Chemistry, 8(3):215–222.
Tagatz ME, Plaia G, Deans C, Lores E (1983) Toxicity of creosote-contaminated sediment to field- and laboratory-colonized estuarine benthic communities. Environmental Toxicology and Chemistry, 2:441–450.
Thomas J, Lee M, Scott M, Ward C (1989) Microbial ecology of the subsurface at an abandoned creosote waste site. Journal of Industrial Microbiology, 4(2):109–120.
Thompson J, Casey P, Vale J (1994) Suspected paediatric pesticide poisoning in the UK. II — Home accident surveillance system 1989–1991. Human Experimental Toxicology, 13(8):534–536.
Tilak B (1960) Carcinogenesis by thiophene isosters of polycyclic hydrocarbons. Tetrahedron, 9:76–95.
Tingle M, Pirmohamed M, Templeton E, Wilson A, Madden S, Kitteringham N, Park B (1993) An investigation of the formation of cytotoxic, genotoxic, protein-reactive and stable metabolites from naphthalene by human liver microsomes. Biochemical Pharmacology, 46(9):1529–1538.
Tobia RJ, Camacho JM, Augustin P, Griffiths RA, Frederick RM (1994) Washing studies for PCP and creosote-contaminated soil. Journal of Hazardous Materials, 38:145–161.
Todd A, Timbie C (1983) Industrial hygiene surveys of occupational exposure to wood preservative chemicals. Cincinnati, OH, US Department of Health and Human Services, National Institute for Occupational Safety and Health (DHHS Publication 83-106).
Törnqvist S, Norell S, Ahlbom A, Knave B (1986) Cancer in the electric power industry. British Journal of industrial Medicine, 43:212–213.
TRI97 (2000) Toxics release inventory. Washington, DC, US Environmental Protection Agency. Available at http://www.epa.gov/tri [cited in ATSDR, 2002].
Tuppurainen K, Halonen I, Ruokojärvi P, Tarhanen J, Ruuskanen J (1998) Formation of PCDDs and PCDFs in municipal waste incineration and its inhibition mechanisms: A review. Chemosphere, 36:1493–1511.
Turney G, Goerlitz D (1990) Organic contamination of ground water at gas works park, Seattle, Washington. Ground Water Monitoring and Remediation, 10:187–198.
UK DoE (1988) Report prepared by the United Kingdom Department of the Environment (no further details given) [cited in Gevao & Jones, 1998].
UNEP (1995) Cleaner production guidelines in industrial wood preservation. Paris, United Nations Environment Programme, pp. 1–16.
USDA (1981) The biologic and economic assessment of pentachlorophenol, inorganic arsenicals, creosote. Vol. 1. Wood preservatives. Washington, DC, US Department of Agriculture (USDA Technical Bulletin No. 1658-1) [cited in Henningsson, 1983].
US EPA (1984a) Coal tar, creosote, and coal tar neutral oil: non-wood preservative uses. Washington, DC, US Environmental Protection Agency, 111 pp. (Position Document No. 2/3; EPA/540/9-87-110; PB 87 178851/AS).
US EPA (1984b) Guidelines establishing test procedures for the analysis of pollutants under the Clean Water Act. US Environmental Protection Agency. Federal Register, 49:43234–43352.
US EPA (1984c) Wood preservative pesticides: Creosote, pentachlorophenol and the inorganic arsenicals. Washington, DC, US Environmental Protection Agency, Office of Pesticide Programs (Position Document No. 4; EPA/540/9-84-003).
US EPA (1987) Health effects assessment for creosote. Cincinnati, OH, US Environmental Protection Agency, Environmental Criteria and Assessment Office, pp. 1–39 (EPA/600/8-88-025; PB 88-179395).
US EPA (1995) Whole effluent toxicity: Guidelines establishing test procedures for the analysis of pollutants. Federal Register, 60(199):53529–53544.
US International Trade Commission (1994) Synthetic organic chemicals. United States production and sales, 1992. Washington, DC, US International Trade Commission (USITC Publication 2720) [cited in ATSDR, 2002].
Utesch D, Eray K, Diehl E (1996) Phototoxicity testing of polycyclic aromatic hydrocarbons (PAH) in mammalian cells in vitro. Polycyclic Aromatic Compounds, 10:117–121.
Van Rooij JGM, Van Lieshout EMA, Bodelier-Bade MM, Jongeneelen FJ (1993a) Effect of the reduction of skin contamination on the internal dose of creosote workers exposed to polycyclic aromatic hydrocarbons. Scandinavian Journal of Work, Environment and Health, 19:200–207.
Van Rooij JGM, Bodelier-Bade MM, Jongeneelen FJ (1993b) Estimation of individual dermal and respiratory uptake of polycyclic aromatic hydrocarbons in 12 coke oven workers. British Journal of Industrial Medicine, 50:623–632.
Van Rooij JGM, Veeger MMS, Bodelier-Bade MM, Scheepers PTJ, Jongeneelen FJ (1994) Smoking and dietary intake of polycyclic aromatic hydrocarbons as sources of interindividual variability in the baseline excretion of 1-hydroxypyrene in urine. International Archives of Occupational and Environmental Health, 66:55–65.
Van Veld P, Ko U, Vogelbein W, Westbrook D (1991) Glutathione S-transferase in intestine, liver and hepatic lesions of mummichog (Fundulus heteroclitus) from a creosote-contaminated environment. Fish Physiology and Biochemistry, 9(4):369–376.
Van Veld P, Vogelbein W, Smolowitz R, Woodin B, Stegeman J (1992) Cytochrome P4501A1 in hepatic lesions of a teleost fish (Fundulus heteroclitus) collected from a polycyclic aromatic hydrocarbon-contaminated site. Carcinogenesis, 13:505–507.
Veith G, Macek K, Petrocelli S, Carroll J (1980) An evaluation of using partition coefficients and water solubility to estimate bioconcentration factors for organic chemicals in fish. In: Eaton J, Parrish P, Hendricks A, eds. Aquatic toxicology. New Orleans, LA, American Society for Testing and Materials, pp. 116–129 (ASTM Special Technical Publication 707).
Verschueren K (1996) Handbook of environmental data on organic chemicals, 3rd ed. New York, NY, John Wiley & Sons.
Viau C (2002) Biological monitoring of exposure to mixtures. Toxicology Letters, 134:9–16
Viau C, Vyskocil A (1995) Patterns of 1-hydroxypyrene excretion in volunteers exposed to pyrene by the dermal route. The Science of the Total Environment, 163:187–190.
Viau C, Vyskocil A, Tremblay C, Morissette L (1993) Urinary excretion of 1-hydroxypyrene in workers exposed to polycyclic aromatic hydrocarbon mixtures. Journal of Occupational Medicine and Toxicology, 2:267–276.
Viau C, Carrier G, Vyskocil A, Dodd C (1995a) Urinary excretion kinetics of 1-hydroxypyrene in volunteers exposed to pyrene by the oral and dermal route. The Science of the Total Environment, 163:179–186.
Viau C, Vyskocil A, Martel L (1995b) Background urinary 1-hydroxypyrene levels in non-occupationally exposed individuals in the Province of Québec, Canada, and comparison with its excretion in workers exposed to PAH mixtures. The Science of the Total Environment, 163:191–194.
Vijayan M, Crampton A (1994) Creosote evaluation project. North Vancouver, British Columbia, EVS Consultants [cited in Bestari et al., 1998b].
Villholth K (1999) Colloid characterization and colloidal phase partitioning of polycyclic aromatic hydrocarbons in two creosote-contaminated aquifers in Denmark. Environmental Science and Technology, 33(5):691–699.
Vines C, Robbins T, Griffin F, Cherr G (2000) The effect of diffusible creosote-derived compounds on development in Pacific herring (Clupea pallasi). Aquatic Toxicology, 51(2):225–239.
Vogelbein WK (1993) Ultrastructural and histological characterization of hepatic neoplasms in mummichog Fundulus heteroclitus inhabiting a creosote-contaminated environment. Marine Environmental Research, 35(1–2):197–198.
Vogelbein WK, Fournie J, Van Veld P, Huggen R (1990) Hepatic neoplasms in the mummichog Fundulus heteroclitus from a creosote-contaminated site. Cancer Research, 50:5978–5986.
von Burg R, Stout T (1992) Toxicology update — Creosote. Journal of Applied Toxicology, 12(2):153–156.
Vyskocil A, Fiala Z, Chenier VV, Krajak L, Ettlerova E, Bukac J, Viau C, Emminger S (2000) Assessment of multipathway exposure of small children to PAH. Environmental Toxicology and Pharmacology, 8:111–118.
Wan M (1991) Railway right-of-way contaminants in the lower mainland of British Columbia: polycyclic aromatic hydrocarbons. Journal of Environmental Quality, 20:228–234.
Warshawsky D, Barkley W, Bingham E (1993) Factors affecting carcinogenic potential of mixtures. Fundamental and Applied Toxicology, 20(3):376–382.
Webb D (1975) Some environmental aspects of creosote. Proceedings of the Annual Meeting of the American Wood-Preservers’ Association, 71:176–181.
Weeks B, Warinner J (1986) Functional evaluation of macrophages in fish from a polluted estuary. Veterinary Immunology and Immunopathology, 12:313–320.
Wester R, Maibach H, Bucks DW (1990) Percutaneous absorption of carbon-14 labelled DDT and carbon-14 labelled benzo(a)pyrene from soil. Fundamental and Applied Toxicology, 15(3):510–516.
Weyand EH, Wu Y, Patel S, Taylor B, Mauro D (1991) Urinary excretion and DNA binding of coal tar components in B6C3F1 mice following ingestion. Chemical Research in Toxicology, 4:466–473.
Weyand EH, Defauw J, McQueen C, Meschter CL, Meegalla SK, La Voie EJ (1993) Bioassay of quinoline, 5-fluoroquinoline, carbazole, 9-methylcarbazole and 9-ethylcarbazole in newborn mice. Food and Chemical Toxicology, 31(10):707–715.
WHO (2000) Polycyclic aromatic hydrocarbons. In: Air quality guidelines for Europe, 2nd ed. Copenhagen, World Health Organization, Reginal Office for Europe, pp. 92–96. (sec10/13)
WHO (2004) Guidelines for drinking-water quality, 3rd ed. , in press
Whyte J, Herbert K, Karrow N, Dixon D, Sivak J, Bols N (2000) Effect of maintaining rainbow trout in creosote microsomes on lens optical properties and liver 7-ethoxyresorufin-O-deethylase (EROD) activity. Archives of Environmental Contamination and Toxicology, 38(3):350–356.
Willeitner H, Dieter H (1984) Steinkohlenteeröl. Holz als Roh- und Werkstoff, 42:223–231.
Wilson J, McNabb J, Cochran J (1986) Influence of microbial adaptation on the fate of organic pollutants in ground water. Environmental Toxicology and Chemistry, 4:721–726.
Wilson S, Jones K (1993) Bioremediation of soil contaminated with polynuclear aromatic hydrocarbons (PAHs): a review. Environmental Pollution, 81:229–249.
Woodhouse D (1950) The carcinogenic activity of some petroleum fractions and extracts. Comparative results in tests on mice repeated after an interval of eighteen months. Journal of Hygiene, 48:121–134.
Wrench R, Britten A (1975) Evaluation of coal tar fractions for use in psoriasiform diseases using the mouse tail test. British Journal of Dermatology, 93:67–74.
Wright CW, Later DW, Wilson BW (1985) Comparative chemical analysis of commercial creosotes and solvent refined coal — II. Materials by high resolution gas chromatography. Journal of High Resolution Chromatography, & Chromatography Communications, 8:283–289.
WS Atkins International Ltd (1997) Study on the justification in scientific terms of allowing Sweden to retain its national laws on creosote in place of Council Directive 94/60/EC. Final report for the European Commission, August [cited in EC, 1999].
Yang M, Koga M, Katoh T, Kawamoto T (1999) A study for the proper application of urinary naphthols, new biomarkers for airborne polycyclic aromatic hydrocarbons. Archives of Environmental Contamination and Toxicology, 36:99–108.
Zapf-Gilje R, Patrick GC, McLenehan R (2001) Overview of the remediation process at sites with creosote related contamination in soil, groundwater and river sediment. Canadian Journal of Civil Engineering, 28(Suppl. 1):141–154.
Zemanek M, Pollard S, Kenefick S, Hrudey S (1997) Toxicity and mutagenicity of component classes of oils isolated from soils at petroleum- and creosote-contaminated sites. Journal of the Air & Waste Management Association, 47(12):1250–1258.
Zitko V (1975) Aromatic hydrocarbons in aquatic fauna. Bulletin of Environmental Contamination and Toxicology, 14:621–631.
The parameters and terms used in deriving the dose–effect relationship, along with their definitions and symbols, are listed in Table A-1 on the next page. The table also includes the equations, dimensions, and units that are used.
While I < 1 always holds, TpT, in contrast, can have any value (>0). Changes can still occur at high doses, but because of the bounds applying to I, they are difficult to resolve experimentally. Thus, TpT is a more suitable parameter for assessing carcinogenicity studies. However, for low incidences, I ≈ TpT.
The probability of finding m tumours (caused through a single-stage damaging process) in a single animal, given a mean value for the population of p, is given by the Poisson distribution, P(p,m) = pm / [Exp(p)·m!]. So that the probability of zero tumours is (m = 0), P(p,0) = Exp(–p). In other words, tumour incidence I is given by I(p) = 1 – Exp(–p). Here, the addition theorem I(p1 + p2) = I(p1) + I(p2) – I(p1) · I(p2) is valid, which ensures that I < 1. If the Poisson distribution is applicable to the incidence of tumours (because TpT ≡ p), then, following algebraic transformation, the following relationship is also valid:
Equation 1: TpT = –ln(1 – I)

The total number of tumours is given by the time integral of the tumour rate as  . Different routes of exposure are considered to be additive in respect to tumour rate. Without restricting the general validity, it holds that tumour rate is a function of time and dose rate (which is also possibly a function of time), i.e.,
  . On the not unreasonable assumption that this function is separable, i.e., can be expressed in the form
  as a product of individual functions, we can obtain a number of simplifications. For example, if
  and
and  , then tumour rate can be expressed as
  , making it proportional to the nth moment of the dose rate. If DR = const = (DR), one gets
  . Of course, in this case, the curve for the total number of tumours with time must be known.
Continuing to assume that n = 0, with the carcinogenicity factor  , one obtains the simplest possible variant,
  , whereby the total number of tumours can be been to be directly proportional to total dose (the question of tumour latency period is not considered here). The carcinogenicity factor, , is the number of tumours per second that arise from the corresponding dose rate. The same relationship is also valid for TpT, of course, when the mean dose rate for the individual animal is used.
In the event of all the above-mentioned assumptions, with the exception of n = 0, being valid, provided the experimental data are all collected after the same time interval, the above model is still applicable, since the factor  is simply expressed in the form of another
  . However, the model can then no longer be used for the investigation of allometric problems (such as
  ).
).
Any function with a value between zero, or just above, and unity and with a dose–argument range from zero to infinity is in principle suitable for formally describing tumour incidence. In toxicology, by restricting oneself to "toxins," one can surely expect incidence to increase uniformly with dose.
Thus, incidence curves can show an inflection, a threshold value, below which no effect occurs, and spontaneous tumour rates can differ. Whether at zero exposure the argument range actually begins at zero is questionable, since there is always some, even if minute, background concentration. By estimating this background concentration and inserting it in place of zero, one can often avoid mathematical difficulties without compromising the results.
Assuming the minimum requirements that an incidence curve must fulfil for the differential equation  , with the boundary condition for spontaneous tumour rate,
  , i.e.,
  , one obtains the following three-parameter function:

This corresponds exactly with the curve of a linearized multistage model (Rees & Hattis, 1994).
The first term on the right of the equation is the beginning of the Taylor expansion of any function around zero. The slope
Table A-1: Overview of parameters/terms and corresponding symbols and relationships.
|
Parameters/ terms |
Definition |
Symbol/relationship |
Dim.a |
Units useda |
|
Population size |
Total number of animals in a population |
N |
–b |
|
|
Tumorous animals |
Number of animals in the population with at least one tumour |
nT |
– |
|
|
Number of tumours |
Total number of tumours of animal i |
ti |
– |
|
|
Total number of tumours |
Total number of tumours in the population |
|
– |
|
|
Incidence |
Probability that the animals of the population have at least one tumour |
I = nT / N |
– |
|
|
Tumours per animal |
Tumour expectation per animal |
TpT = T / N |
– |
tumours/animal |
|
Exposure rate |
Absolute mean substance uptake rate by the test animals |
|
kg/s |
µg BaP/day |
|
Body weight |
Mean body weight of the test animal |
M |
kg |
kg body weight |
|
Dose rate |
Weight- or animal-related exposure rate |
|
1/s |
µg BaP/(day·kg body weight) or µg BaP/(day·animal) |
|
Total dose |
Time integral of the dose rate over treatment period te |
|
– |
µg BaP/kg body weight or µg BaP/animal |
|
Total exposure |
Time integral of exposure rate over treatment period te |
|
kg |
µg BaP |
|
Tumour rate |
Probability of occurrence of tumour per unit time |
TR |
1/s |
tumours/(animal × day) |
|
Slope factor |
Slope of the incidence curve at D = 0 |
|
– |
|
|
Carcinogenicity factor |
Slope factor for tumours per animal |
|
– |
tumours × kg body weight / µg BaP or tumours/(animal·µg BaP) |
|
Unit risk |
Incidence at unit dose minus spontaneous incidence |
I(1) – I(0) |
a Dimensions are always given in basic rather than derived units: metre, kilogram, second, ampere. To facilitate understanding, the units used are also given.
b Dimensionless; numerical reasons can nevertheless suggest use of units, e.g., (g carcinogen/kg body weight).
c According to the calculus mean value rule, the relationship between total dose and mean dose rate  is
is  .
.
factor is thus given by  , and the unit risk by
  .
.
A comparison of the above (continuous) solution with the (discrete) Poisson statistics shows (again with Isp <<1) that the term in the exponent can be identified with TpT, so that

Thus, our evaluation represents a de facto linearized multistage model.
The detailed analysis of the Fraunhofer study (Buschmann et al., 1997) is still unpublished, so it is described briefly here. Instead of the frequently employed, formal, standard evaluation with the linearized multistage model, we chose to plot the logarithm of the number of tumours per animal against the logarithm of the dose rate, since over the whole range of dose rates this facilitated the interpretation of the primary data. At low tumour rates, for example, one can immediately see whether or not a threshold is approached, while at high tumour rates it is possible to ascertain additivity, even when tumour incidence is approaching saturation (see section A1.2). Nevertheless, from the remarks made in section A1.4, it is clear that the two methods of evaluation are essentially identical, thus yielding the same results.
The following, however, is only a general account of the applied procedure, a detailed description of which, including the functions on which it is based, being provided in section A1, where Table A-1 offers an overview of the applied relationships and the functions on which they are based, as well as dimensions and units.
In the figures, the measure of carcinogenic effect, on the ordinate, is expressed in terms of the number of tumours per animal, instead of in the more usual term of tumour incidence, the number of tumour-bearing animals in relation to the total number treated. This is based on the consideration that at higher concentrations, tumour incidence is subject to saturation, while the number of tumours per animal continues to increase. The total number of tumours, or the mean number of tumours per animal, is a better parameter on which to base the dose–effect relationship. On the relationship between the number of tumours per animal and tumour incidence, see Equation 1 in section A1.2.
As a measure of the applied dose, the dose rate of BaP in the creosote was expressed on the abscissa. BaP was chosen as the reference parameter in order to be able to compare the two creosote samples with pure BaP. Dose rate is a measure of the applied dose of BaP. In order to obtain the dose rate, the dose that was applied twice a week was converted to dose per day. This parameter was chosen for the figures because it is used to obtain the slope factors (Table A-1).
In order to analyse the dose–effect relationship, in Figure A-1, the number of tumours per animal, expressed as the logarithm, is shown in relation to the logarithm of the BaP dose rate. As a first approximation, most of the points lie on a straight line, only the point corresponding to the highest dose of CTP2 (9 mg group, in which treatment was terminated prematurely) and BaP itself not fitting into the dose–effect relationship.
As already it is possible that the occurrence of ulceration disturbs the dose–effect relationship, in Figure A-2, only the data for those animals in which treatment was not interrupted are used. Disregarding the highest CTP2 dose level, it is clear that this results in a better dose–effect relationship. However, this evaluation neglects the reduction in survival time with increasing dose rate, which, on account of the positive correlation between tumour rate and survival time, makes additional correction measures necessary.
Thus, in Figure A-3, survival rate was also taken into account, at each dose level the number of tumours per animal being divided by the average survival time in order to obtain the tumour rate in tumours/(animal × day). Particularly in the group in which treatment was prematurely terminated, this correction resulted in a marked increase in tumour rate compared with the lower dose levels. This is reflected in Figure A-3, where now all the points, with the exception of that for BaP, fall on a straight line.
It can also be clearly seen that BaP on its own shows a weaker carcinogenic effect than the two creosote samples with corresponding BaP concentrations.
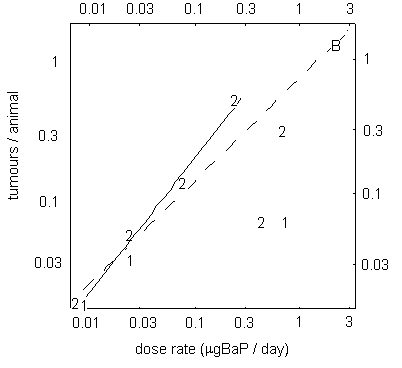
Fig. A-1: Number of tumours per animal as a function of dose rate.
All animals. 1 = CTP1; 2 = CTP2; B = BaP alone; —
= fitted to CTP data, but excluding the highest CTP2 dose rate;
--- = fitted to all the data, including data for BaP.
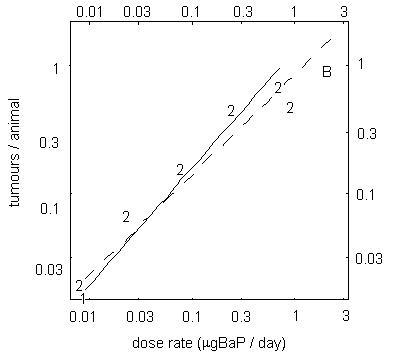
Fig. A-2: Number of tumours per animal.
Only animals without ulcerations. 1 = CTP1; 2 = CTP2; B = BaP alone; — = fitted to CTP data; --- = fitted to all the data, including data for BaP.
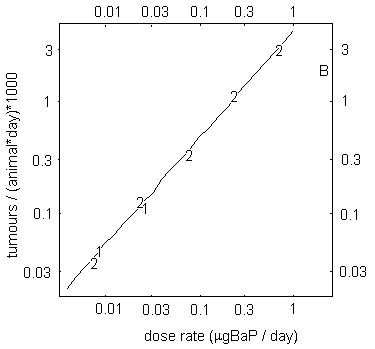
Fig. A-3: Tumour rate as a function of dose rate.
Only animals without ulcerations; adjusted for survival and actual dosage. 1 = CTP1; 2 = CTP2; B = BaP alone; — = fitted to CTP data.
For the relationship of BaP dose rate (Figure A-3) to the tumour rate TR, one obtains the following exponential function:
Equation 2: 
TR = 1.31 (95% CI = 1.08–1.59) × DR0.96 (95% CI = 0.88–1.05)
where:
TR = tumour rate per day;
DR = dose rate (µg/day).
The exponent of 0.96 indicates a linear dose–effect relationship in the concentration range under study. In particular, no deviation from this relationship is found in the lower concentration range, thus providing no support for the hypothesis of a threshold value.
The value b = 1 is a plausible and simple value (strict dose–effect proportionality). Thanks to this linear relationship, "a" can be given an interpretable physical dimension. Thus, equation 2, above, can be simplified to TR = a ´ DR.
For this case, "a" can be defined as the specific carcinogenicity factor k dermal:
k dermal = TR / DR [tumours / (animal × µg BaP)]
= 4.9 × 10⁻³ tumours/(animal ´ µg BaP)
As described above, k dermal was derived from the number of tumours per animal and corresponds to the slope factor, which is normally determined from tumour incidences.
In order to calculate lifetime risk with help of k dermal, this must be multiplied by the lifetime dose and corresponds to a lifetime cumulative risk of 10–4 for a daily dose of creosote corresponding to a BaP dose of 1 ng/kg body weight.
Up until now we have implicitly assumed that at the point of time t, the true incidence, i.e., the true number of tumours per animal, is ascertainable. However, depending on the type of tumour and its location, a latency period may occur, during which time the tumour is not detectable. The following relationship holds:  or
or  and
and  (for the example of incidence). The true value for incidence is indicated by the index w, the observed value by the index obs, and the not observable value by the index no. If the latency period (which is generally related to dose (rate)) can be determined, explicit corrections may be applied. Only in the simplest case of constant dose rate, where n = 0 (see above), is
  valid for the observed tumour rate, meaning that the observed tumour rate is too small by the amount in brackets. From the data (see Figure A-4), one can conclude that the expected error factor (given a treatment period of te = 548 days), depending on dose rate, will be in the range of 0.45–0.82. This means that for the doses investigated here, tumour rate would be increased by a factor of 2 at the most.
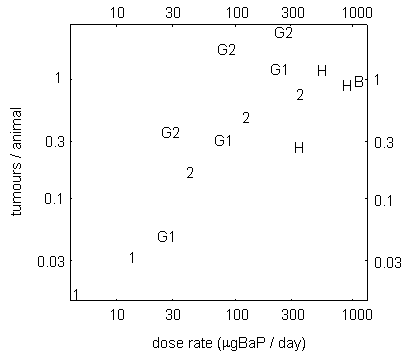
Fig. A-4: Number of tumours per animal for BaP itself and for various PAH mixtures in studies of dermal carcinogenicity.
1 = CTP1; 2 = CTP2; B = BaP (Buschmann et al., 1997); G1 = lubricating oil (Grimmer et al., 1982); G2 = flue gas condensation products (Grimmer et al., 1985); H = BaP (Habs et al., 1980)
Buschmann J, Bartsch W, Dasenbrock C, Ernst H, Schneider B, Preiss A (1997) Dermal carcinogenicity study of two coal tar products (CTP) by chronic epicutaneous application in male CD-1 mice (78 weeks). Unpublished report prepared by Fraunhofer Institute of Toxicology and Aerosol Research, Hanover, for Rütgers-VfT AG, Duisburg.
Grimmer G, Dettbarn G, Brune H, Deutsch-Wenzel R, Misfeld J (1982) Quantification of the carcinogenic effect of polycyclic aromatic hydrocarbons in used engine oil by topical application onto the skin of mice. International Archives of Occupational and Environmental Health, 50:95–100.
Grimmer G, Brune H, Deutsch-Wenzel R, Dettbarn G, Misfeld J, Abel U, Timm J (1985) The contribution of polycyclic aromatic hydrocarbon fractions with different boiling ranges to the carcinogenic impact of emission condensate from coal fired residential furnaces as evaluated by topical application to the skin of mice. Cancer Letters, 28:203–211.
Habs M, Schmähl S, Misfeld J (1980) Local carcinogenicity of some environmentally relevant polycyclic aromatic hydrocarbons after lifelong topical application to mouse skin. Geschwulstforschung, 50:266–274.
Mangelsdorf I, Boehncke A, Holländer W (1998) Evaluation of a dermal carcinogenicity study with mice with two different creosotes. Prepared by the Fraunhofer Institute of Toxicology and Aerosol Research for the German Federal Ministry of Environment, Nature Conservation and Nuclear Safety, based on a dermal carcinogenicity study conducted for Rütgers-VfT AG, Duisburg, 27 pp.
Rees DC, Hattis D (1994) Developing quantitative strategies for animal to human extrapolation. In: Hayes AW, ed. Principles and methods of toxicology, 3rd ed. New York, NY, Raven Press, pp. 275–315.
Hanover, Germany
20–23 January 2003
Participants
D. Anderson, University of Bradford, Bradford, West Yorkshire, United Kingdom
R.S. Chhabra, National Institute of Environmental Health Sciences, Research Triangle Park, NC, USA
P. Heikkilä, Finnish Institute of Occupational Health, Helsinki, Finland
F. Jongeneelen, IndusTox Consult, Nijmegen, The Netherlands
A. Juhasz, CSIRO Land and Water, Glen Osmond, Australia
J. Kielhorn, Fraunhofer Institute of Toxicology and Experimental Medicine, Hanover, Germany
C. Magnani, SCDU Epidemiologia dei Tumori, Torino, Italy
H. Malcolm, Centre for Ecology & Hydrology, Monks Wood, United Kingdom
I. Mangelsdorf, Fraunhofer Institute of Toxicology and Experimental Medicine, Hanover, Germany
C. Melber, Fraunhofer Institute of Toxicology and Experimental Medicine, Hanover, Germany
D. Todd, Division of Toxicology, Agency for Toxic Substances and Disease Registry, Atlanta, GA, USA
Secretariat
Dr A. Aitio, International Programme for Chemical Safety, World Health Organization, Geneva, Switzerland
The draft CICAD on coal tar creosote was sent for review to IPCS national Contact Points and Participating Institutions, as well as to identified experts. Comments were received from:
R. Benson, Drinking Water Program, US Environmental Protection Agency, Denver, CO, USA
J.H. Butala, Gibsonia, PA, USA, for Creosote Council II
C. Chen, National Center for Environmental Assessment, US Environmental Protection Agency, Washington, DC, USA
P. Copestake, Toxicology Advice & Consulting Ltd, Surrey, United Kingdom
L. Davies, Department of Health and Ageing, Canberra, Australia
K. Dragon, National Institute for Occupational Safety and Health, Cincinnati, OH, USA
C. Elliot-Minty, Health and Safety Executive, Bootle, Merseyside, United Kingdom
L. Fishbein, Private Consultant, Fairfax, VA, USA
H. Gibb, National Center for Environmental Assessment, US Environmental Protection Agency, Washington, DC, USA
J. Haseman, National Institute of Environmental Health Sciences, Research Triangle Park, NC, USA
R.F. Hertel, Federal Institute for Risk Assessment, Berlin, Germany
H. Hoeke, Chemisch-Toxicologische Beratung, Weinheim, Germany
J.A. Holme, Norwegian Institute of Public Health, Oslo, Norway
B. Jernström, Karolinska Institute, Stockholm, Sweden
E. Soderlund, Norwegian Institute of Public Health, Oslo, Norway
J.L. Stauber, CSIRO Energy Technology, Bangor, Australia
Varna, Bulgaria
8–11 September 2003
Members
Dr I. Benchev, Sofia, Bulgaria
Dr R. Chhabra, National Institute of Environmental Health Sciences, Research Triangle Park, NC, USA
Dr C. De Rosa, Agency for Toxic Substances and Disease Registry, Centers for Disease Control and Prevention, Atlanta, GA, USA
Dr S. Dobson, Centre for Ecology and Hydrology, Monks Wood, Abbots Ripton, Huntingdon, Cambridgeshire, United Kingdom
Dr G. Dura, National Institute of Environment, József Fodor Public Health Centre, Budapest, Hungary
Dr L. Fishbein, Fairfax, VA, USA
Dr H. Gibb, National Center for Environmental Assessment, US Environmental Protection Agency, Washington, DC, USA
Dr R.F. Hertel, Federal Institute for Risk Assessment, Berlin, Germany
Mr P. Howe, Centre for Ecology and Hydrology, Monks Wood, Abbots Ripton, Huntingdon, Cambridgeshire, United Kingdom
Dr S. Ishimitsu, Division of Safety Information on Drug, Food and Chemicals, National Institute of Hygienic Sciences, Tokyo, Japan
Dr D. Kanungo, Central Insecticides Board, Directorate of Plant Protection, Quarantine & Storage, Ministry of Agriculture, Haryana, India
Dr J. Kielhorn, Fraunhofer Institute of Toxicology and Experimental Medicine, Hanover, Germany
Ms B. Meek, Environmental Health Directorate, Health Canada, Ottawa, Ontario, Canada
Dr T. Morita, Division of Safety Information on Drug, Food and Chemicals, National Institute of Hygienic Sciences, Tokyo, Japan
Mr F.K. Muchiri, Directorate of Occupational Health and Safety Services, Nairobi, Kenya
Dr L. Olsen, Biological Monitoring & Health Assessment Branch, Division of Applied Research & Technology, National Institute for Occupational Safety and Health, Cincinnati, OH, USA
Dr N. Rizov, National Center of Hygiene, Medical Ecology and Nutrition, Sofia, Bulgaria
Dr P. Schulte, Education and Information Division, National Institute for Occupational Safety and Health, Cincinnati, OH, USA
Dr J. Sekizawa, Faculty of Integrated Arts and Sciences, Tokushima University, Tokushima, Japan
Dr F.P. Simeonova, Sofia, Bulgaria
Dr S. Soliman, Faculty of Agriculture, Alexandria University, El Shatby, Alexandria, Egypt
Dr J. Stauber, CSIRO Energy Technology, Centre for Advanced Analytical Chemistry, Bangor, NSW, Australia
Mr P. Watts, Toxicology Advice & Consulting Ltd, Surrey, United Kingdom
Ms D. Willcocks, National Industrial Chemicals Notification and Assessment Scheme, Sydney, NSW, Australia
Dr K. Ziegler-Skylakakis, European Commission, Luxembourg
Observers
Dr S. Jacobi, Degussa AG, Fine Chemicals, Hanau-Wolfgang, Germany
Mr M. Southern, Shell International Petroleum Company Ltd, London, United Kingdom
Dr W. ten Berge, DSM, Heerlen, The Netherlands
Secretariat
Dr A. Aitio, International Programme on Chemical Safety, World Health Organization, Geneva, Switzerland
Mr T. Ehara, International Programme on Chemical Safety, World Health Organization, Geneva, Switzerland
|
ACW |
American Creosote Works |
|
AhR |
aryl hydrocarbon receptor |
|
APA |
alkaline precipitation assay |
|
APHA |
American Public Health Association |
|
ATP |
adenosine triphosphate |
|
AWPA |
American Wood-Preservers’ Association |
|
BaP |
benzo[a]pyrene |
|
BCF |
bioconcentration factor |
|
BSAF |
biota–sediment accumulation factor |
|
BSM |
benzene-soluble matter |
|
BTEX |
benzene, toluene, ethylbenzene, and xylene |
|
CAS |
Chemical Abstracts Service |
|
CI |
confidence interval |
|
CICAD |
Concise International Chemical Assessment Document |
|
CSM |
cyclohexane-soluble matter |
|
CTPV |
coal tar pitch volatiles |
|
CYP |
cytochrome P450 |
|
DCM |
dichloromethane |
|
DEO |
dichloromethane-extractable organics |
|
DMSO |
dimethylsulfoxide |
|
DNA |
deoxyribonucleic acid |
|
DNT |
2,6-dinitrotoluene |
|
EC50 |
median effective concentration |
|
ECD |
electron capture detector |
|
EHC |
Environmental Health Criteria |
|
EPA |
Environmental Protection Agency (USA) |
|
EROD |
ethoxyresorufin-O-deethylase |
|
EU |
European Union |
|
FID |
flame ionization detector |
|
FL |
fluorescence detector |
|
GC |
gas chromatography |
|
GJIC |
gap junctional intercellular communication |
|
HAC |
heterocyclic aromatic compound |
|
HMWF |
high-molecular-weight fraction |
|
HPLC |
high-performance liquid chromatography |
|
HRGC |
high-resolution gas chromatography |
|
IARC |
International Agency for Research on Cancer |
|
IC50 |
median inhibitory concentration |
|
ICSC |
International Chemical Safety Card |
|
ILO |
International Labour Organization |
|
IPCS |
International Programme on Chemical Safety |
|
Km |
Michaelis-Menten constant |
|
Koc |
organic carbon sorption coefficient |
|
Kow |
octanol/water partition coefficient |
|
Ktw |
tar/water partition coefficient |
|
LC50 |
median lethal concentration |
|
LD50 |
median lethal dose |
|
LMWF |
low-molecular-weight fraction |
|
LOAEL |
lowest-observed-adverse-effect level |
|
LOEC |
lowest-observed-effect concentration |
|
MAH |
monocyclic aromatic hydrocarbon |
|
MS |
mass spectrometry |
|
MSD |
mass selective detector |
|
NAPL |
non-aqueous-phase liquid |
|
NIOSH |
National Institute for Occupational Safety and Health (USA) |
|
NOAEL |
no-observed-adverse-effect level |
|
NOEC |
no-observed-effect concentration |
|
NOEL |
no-observed-effect level |
|
NPAC |
nitrogen-containing polycyclic aromatic compound |
|
NSO |
nitrogen, sulfur, oxygen heterocycles |
|
n.sp. |
not specified |
|
NTA |
nick translation assay |
|
OR |
odds ratio |
|
OSHA |
Occupational Safety and Health Administration (USA) |
|
PAH |
polycyclic aromatic hydrocarbon |
|
PCB |
polychlorinated biphenyl |
|
PCDD |
polychlorinated dibenzo-p-dioxin |
|
PCDF |
polychlorinated dibenzofuran |
|
PCP |
pentachlorophenol |
|
PIM |
Poison Information Monograph |
|
PROD |
pentoxyresorufin-O-depentylase |
|
PTFE |
polytetrafluoroethylene |
|
PVC |
polyvinyl chloride |
|
RR |
relative risk |
|
SD |
standard deviation |
|
SIM |
selective ion monitoring |
|
SIR |
standardized incidence ratio |
|
SPE |
solid-phase extraction |
|
SSR |
simulated solar radiation |
|
T25 |
daily dose inducing a tumour incidence of 25% upon lifetime exposure |
|
TCDD |
2,3,7,8-tetrachlorodibenzo-p-dioxin |
|
TLC |
thin-layer chromatography |
|
TWA |
time-weighted average |
|
UNEP |
United Nations Environment Programme |
|
USA |
United States of America |
|
US EPA |
United States Environmental Protection Agency |
|
UV |
ultraviolet |
|
Vmax |
maximum rate |
|
v/v |
volume per volume |
|
WHO |
World Health Organization |
|
WSF |
water-soluble fraction |
|
w/w |
weight per weight |
La première version du présent CICAD a été préparée par l’Institut Fraunhofer de toxicologie et de médecine expérimentale de Hanovre.5 Une étude bibliographique très complète des bases de données intéressantes a été effectuée en juin 2002. La première version du document a été distribuée en vue d’un examen restreint par des pairs et un groupe consultatif s’est réuni pour y mettre la dernière main et s’assurer qu’il avait été tenu dûment compte des observations formulées lors de l’examen en question. La liste des membres du groupe consultatif, qui ont également participé à l’examen par des pairs, figure à l’appendice 2. La version finale a été ensuite communiquée aux points de contact de l’IPCS et aux institutions participantes en vue d’un nouvel examen par des pairs, ainsi qu’à d’autres experts désignés en collaboration avec le Groupe d’orientation pour l’évaluation des risques de l’IPCS. Des renseignements sur l’examen par des pairs du présent CICAD sont donnés à l’appendice 3. Ce CICAD a été approuvé en tant qu’évaluation internationale lors de la réunion du Comité d’évaluation finale qui s’est tenue à Varna (Bulgarie) du 8 au 11 septembre 2003. La liste des membres de ce comité est donnée à l’appendice 4. La fiche internationale sur la sécurité chimique de la créosote (ICSC 0572) établie par le Programme international sur la sécurité chimique (IPCS, 2002) est également reproduite dans le présent document.
Le présent CICAD porte sur la créosote de goudron de houille. La créosote de bois est un produit différent, principalement utilisé pour des préparations pharmaceutiques (créosote officinale) et elle n’est pas traitée dans ce document.
La créosote de goudron de houille se présente sous la forme d’un liquide huileux brunâtre à noir ou jaunâtre à vert foncé, doté d’une odeur caractéristique. On l’obtient par distillation fractionnée de goudrons de houille bruts. Elle distille approximativement entre 200 et 400 °C. La composition chimique de la créosote dépend de l’origine de la houille ainsi que du mode de distillation. Les constituants de la créosote sont donc rarement de même nature et de même concentration.
La créosote est un mélange de plusieurs centaines, voire d’un millier de substances chimiques, dont un petit nombre seulement est présent dans une proportion supérieure à 1 %. Ces constituants se répartissent en six groupes principaux : des hydrocarbures aromatiques, notamment des hydrocarbures aromatiques polycycliques (HAP) et leurs dérivés alkylés (qui peuvent constituer jusqu’à 90 % de la créosote); des acides de goudron / phénols; des bases de goudron / hétérocycles azotés; des amines aromatiques et des hétérocycles soufrés ou oxygénés comme les dibenzofurannes. La créosote est commercialisée sous la forme de préparations diluées dans de l’huile ou un solvant. La composition et l’usage de ce produit est réglementée dans certains pays; cette réglementation porte habituelement sur la teneur en benzo[a]pyrène (BaP) et en dérivés phénoliques.
La créosote n’est que légèrement soluble dans l’eau, mais soluble dans divers solvants organiques. Toutefois, les propriétés physiques et chimiques des constituants de ce produit varient largement de l’un à l’autre et certains, par exemple, sont très solubles dans l’eau.
L’analyse de la créosote se révèle complexe. Les subtances chimiques qui la constituent offrent un profil différent selon la matrice dans laquelle elles se trouvent : les plus volatiles se retrouvent dans l’air, les plus solubles dans l’eau et celles qui présentent la capacité de sorption la plus élevée, dans les sédiments et le sol. Selon la matrice dans laquelle la prise d’essai a été prélevée (air, eau, sol, sédiments ou encore produits biologiques), il faut procéder à une purification et à une extraction. Les méthodes de séparation et de recherche/ dosage les plus couramment utilisées sont la chromatographie en phase gazeuse à haute résolution avec détection par ionisation de flamme ou spectrométrie de masse ou encore la chromatographie en phase liquide à haute performance avec détection par fluorescence.
La surveillance de l’exposition professionnelle aux particules de créosote se faisait antérieurement par dosage des dérivés volatils issus du brai de goudron de houille, mais cette méthode n’est pas suffisamment sensible pour la mesure de faibles quantités de vapeurs de créosote. Les constituants importants, les HAP présents dans l’air par exemple, peuvent être captés sur un filtre de polytétrafluoréthylène relié à un tube d’absorption, puis dosés par chromatographie en phase gazeuse à haute résolution ou chromatographie en phase liquide à haute performance après extraction. Les autres constituants volatils de la créosote peuvent également être captés au moyen de tubes d’absorption.
On a également recours au dosage de métabolites urinaires des HAP, comme le 1-pyrénol (1-hydroxypyrène) ou le 1-naphtol (1-hydroxynaphtalène) pour évaluer l’exposition à la créosote.
La créosote de goudron de houille est utilisée pour la protection du bois et comme agent hydrofuge sur certaines structures en bois utilisées en milieu terrestre ou aquatique (eau de mer ou eau douce). On l’emploie ainsi pour traiter les traverses de voies ferrées ou les traverses d’aiguillage, la couverture des ponts et des quais, les poteaux, les maisons en rondins, les barrières et clôtures et l’équipement des terrains de jeux.
Dans l’Union européenne, la créosote est utilisée en majeure partie pour l’imprégnation du bois sous pression. Aux Etats-Unis et dans beaucoup d’autres pays, l’utilisation de la créosote de goudron de houille est réservée à des professionnels agréés.
En dehors du traitement du bois, on utilise également la créosote pour protéger contre les salissures les pilotis de béton immergés en mer. Elle peut également entrer dans la composition des produits d’étanchéité pour toitures comme le brai à couverture, du mazout, du noir de fumée et peut servir de lubrifiant pour le démoulage. Elle s’utilise aussi comme répulsif contre certains animaux - oiseaux, notamment - comme insecticide, pour la préparation de bains destinés aux animaux et comme fongicide.
Aux Etats-Unis, la production de créosote se divise en deux catégories : la créosote de distillation (100 %) et la créosote en solution de goudron de houille. La production de distillat a été de 240 000 tonnes en 1992 et celle de créosote en solution de goudron de houille, de 110 000 tonnes. Dans l’Union européenne, la production de créosote est estimée à environ 60 000 - 100 000 tonnes par an.
Lors de l’imprégnation du bois sous pression, de la créosote en excès peut être libérée par les matériaux traités. Il est fréquent que de la créosote soit entraînée par lessivage de restes de produit répandus sur les sites de traitement. De la créosote peut également être libérée dans l’environnement par les émissions provenant des ateliers où ce produit est utilisé.
Le transport et la distribution de la créosote dans l’environnement sont des processus complexes qui dépendent, outre des conditions environnementales, des propriétés physico-chimiques des constituants de ce produit et de leurs interactions avec la matrice qui les contient. D’une façon générale, la créosote se retrouve dans tous les compartiments de l’environnement (air, eau, sédiments, sol et biotes). Les principaux lieux de dépôt sont toutefois les sédiments, le sol et les eaux souterraines.
Les phénols, les hydrocarbures aromatiques polycycliques de faible masse moléculaire et certains hétérocycles ont généralement tendance à se retrouver plutôt dans la phase gazeuse. Les constituants de la créosote peuvent également être présents dans l’atmosphère sous forme particulaire.
On estime que l’évaporation de la créosote à partir des étendues d’eau ne constitue pas un phénomène important.
Le mouvement de la créosote dans les systèmes aquatiques est lié aux propriétés de ses constituants : solubilité dans l’eau, affinité pour les différentes phases organiques et capacité de sorption. En général, ce sont les phénols, les hétérocycles et les HAP de faible masse moléculaire qui en constituent la fraction fortement soluble. Les dérivés aromatique de masse moléculaire élevée, qui sont relativement peu solubles et présentent une forte capacité d’adsorption, prédominent dans les sédiments. Ceci dit, les composés de masse moléculaire élevée peuvent également être transportés avec des contaminants fixés par sorption sur des colloïdes.
Les observations sur le terrain et des expériences de lessivage en laboratoire montrent que des constituants de la créosote peuvent passer dans le milieu aquatique lorsque des structures de bois traitées par ce produit sont immergées dans l’eau. Ces constituants sont plus facilement lixiviés par l’eau douce que par l’eau de mer. Le taux de migration dans l’eau augmente avec la température et diminue avec l’âge des pilotis. Les hétérocycles azotés sont plus rapidement lixiviés que les HAP et le dibenzofuranne.
La vitesse de transport horizontal et vertical des constitutants de la créosote dans le sol dépend de leurs propriétés physico-chimiques ainsi que des propriétés du sol et des conditions environnementales. La modélisation en laboratoire et des expériences sur le terrain (simulation de déversements de créosote) ont montré qu’à un transport fortement retardé des composés de masse moléculaire élevée était associée une migration rapide des composés de faible masse moléculaire vers le bas. Certains des constituants de la créosote libérés dans le sol environnant par des structures en bois imprégné sont susceptibles d’y demeurer pendant des décennies.
Les HAP de la créosote sont absorbés en faible proportion par les plantes et les animaux terrestres. On ne possède pas de données quantitatives sur l’absorption de constituants de la créosote par des animaux d’élevage. Un certain nombre d’études effectuées sur des invertébrés aquatiques ainsi que la surveillance de poissons au laboratoire et dans leur milieu naturel ont mis en évidence une absorption non négligeable des HAP de la créosote par ces organismes. Il est possible que ces composés puissent passer dans l’organisme humain par consommation de poissons et de fruits de mer contaminés.
La biodégradabilité des constituants de la créosote est variable. Généralement, la décomposition se fait plus facilement en aérobiose qu’en anaérobiose. La biodégradation des phénols est relativement facile. Dans le cas des HAP, la biodégradabilité est inversement proportionnelle au nombre de noyaux aromatiques. Certains hétérocycles sont rapidement éliminés, alors que d’autres résistent à la biodégradation. Il semble que la biotransformation des constituants de la créosote l’emporte sur leur minéralisation. Dans certains cas, il se forme des produits intermédiaires qui peuvent être plus persistants, plus mobiles et plus toxiques que les composés initiaux.
Outre les caractéristiques structurales de ces substances, un certain nombre d’autres facteurs, comme la biodisponibilité, l’adaptation microbienne, l’apport d’oxygène et la présence de nutriments interviennent dans leur dégradation ou leur transformation in situ.
Bien que la question ait été peu étudiée, il semble que les poissons métabolisent les HAP de la créosote plus rapidement que les invertébrés aquatiques.
La conversion photochimique semble être le mécanisme abiotique le plus important par lequel les constituants de la créosote, comme les HAP, les hétérocycles et les phénols se transforment dans l’atmosphère et, dans une moindre mesure, dans le sol et dans l’eau. La photo-oxydation l’emporte sur la photolyse directe. Une étude au cours de laquelle on a irradié certains HAP, soit séparément, soit dans un mélange de type créosote, a montré que la photoréactivité de ces composés avait tendance à être moindre lorsqu’ils étaient mélangés.
Les invertébrés aquatiques et les poissons accumulent les constituants de la créosote, comme on l’a montré, principalement dans le cas des HAP, à l’occasion d’études de terrain sur des sites contaminés par de la créosote, lors d’expériences de déplacement ou encore lors d’études en laboratoire ou d’essais sur microécosystèmes. En général, le profil de bioaccumulation des HAP chez les insectes et les écrevisses est voisin de ce que l’on observe dans les sédiments, alors que chez les poissons le rapport des HAP de faible masse moléculaire aux HAP de masse moléculaire élevée est considérablement modifié. Il est rare que les facteurs de bioconcentration résultant d’une exposition à la créosote soient publiés. On estime toutefois que dans le cas des HAP, le facteur de bioconcentration résultant d’une exposition à des sédiments contaminés par de la créosote, a une valeur comprise entre 0,3 et 73 000.
On a imaginé un certain nombre de stratégies de remédiation, principalement pour traiter des sols et des nappes phréatiques contaminées. Dans la plupart des cas, le traitement a permis de réduire sensiblement la concentration de certaines substances, mais il a été totalement ou partiellement impuissant à réduire la toxicité des matrices contaminées.
Le bois traité à la créosote ne se décompose pas dans la nature, aussi son élimination pose t-elle un problème. Il ne faut pas procéder à l’incinération incontrôlée de bois traité à la créosote; en effet, cette opération risquerait de libérer dans l’environnement des produits toxiques tels qu’HAP, dioxines halogénées ou furannes.
Les très rares données dont on dispose concernant les concentrations dans l’air ambiant se rapportent à certains HAP retrouvés à proximité d’installations où de la créosote est produite ou utilisée. Dans le cas du naphtalène, on a relevé une concentration maximale égale à 90 ng/m3 à une distance de 2000 m. La concentration de ces produits diminuait à mesure que l’on s’éloignait de l’installation : elle passait par exemple de 64 ng/m3 à 500 m à 1,6 ng/m3 à 5000 m dans le cas du fluoranthène et de 5 ng/m3 à 100 m à 0,6 ng/m3 à 2000 m dans le cas du BaP.
On a constaté dans plusieurs pays que des échantillons d’eaux souterraines prélevés à proximité de sites pollués par des déchets de créosote contenaient des HAP, des hétérocycles et un groupe de composés (benzène, toluène, éthylbenzène et xylène = BTEX) habituellement présents dans la créosote. Au Danemark, les données de surveillance de 44 sites où de la créosote est présente indiquent des concentrations (90ème percentile) de 30 μg/litre de BaP et de 50 μg/litre de chrysθne. Les concentrations les plus élevées de plusieurs hétérocycles, phénols ou composés du groupe BTEX relevées au voisinage de sites contenant des déchets de créosote se situaient entre 10 et 80 mg/litre.
Dans l’eau d’un cours d’eau où de la créosote avait été déversée 10 ans auparavant, on a relevé la présence de certains HAP à des concentration de l’ordre du mg/litre. Dans un canal de drainage situé à proximité d’un site où était travaillée de la créosote, on a surveillé la concentration de douze HAP. Les valeurs maximales allaient de 0,02 μg/litre dans le cas du benzo[b]- et du benzo[k]fluoranthène à 153 μg/litre dans le cas du naphtalène, avec une concentration pouvant atteindre 0,05 μg/litre pour le BaP.
De fortes concentrations de HAP ont été également relevées dans de petits canaux, dont les rives étaient protégées par des structures en bois traité par la créosote, ainsi que dans des fossés longeant des voies ferrées où étaient érigés des poteaux de bois traité à la créosote destinés à supporter des lignes électriques ou téléphoniques. La concentration de BaP la plus forte qui ait été mesurée était de 2,5 μg/litre. Dans les fossés, la concentration moyenne des HAP totaux était égale à 600 μg/litre.
A proximité d’ateliers de traitement du bois, on a relevé dans les sédiments des concentrations en HAP totaux comprises entre 20 000 et 30 000 mg/kg de poids sec; la teneur maximale en hétérocycles azotés était de l’ordre de 1000 mg/kg de poids sec. Des concentrations en BaP pouvant atteindre plusieurs centaines de mg/kg de poids sec ont été mesurées. L’hétérocycle le plus abondant était le carbazole (18 mg/kg de poids sec). Dans des sédiments situés à proximité de structures en bois traité à la créosote, tels que pilotis, palplanches de protection des berges, poteaux ou traverses, on a constaté que la concentration des HAP totaux pouvait atteindre 1200 mg/kg de poids sec, la concentration moyenne du BaP étant d’environ 2 mg/kg de poids sec.
Dans plusieurs pays, la présence de concentrations élevées de constituants de la créosote a été attestée dans des sols situés à proximité d’installations industrielles abandonnées où ce produit avait été fabriqué ou utilisé, avec des valeurs maximales de plusieurs milliers de mg/kg de poids sec dans le cas des HAP totaux et de près de 100 mg/kg pour les phénols totaux. Aux abords de poteaux de bois traité à la créosote, on a signalé la présence de « constituants d’huile de créosote » à des concentrations allant jusqu’à 90 000 mg/kg de poids sec. Dans le sol d’une aire de stockage de traverses de chemin de fer traitées à la créosote ainsi que dans le sable de bacs à sable pour enfants confectionnés à l’aide de vieilles traverses imprégnées de créosote, on a relevé la présence d’HAP à une concentration totale allant respectivement jusqu’à 20 mg/kg et environ 2 mg/kg de poids sec. A proximité de sites de stockage ou de traitement de bois à la créosote, la concentration du BaP dans le sol atteignait la valeur maximale de 390 mg/kg de poids sec; elle atteignait 6 mg/kg autour de poteaux imprégnés et 0,2 mg/kg dans le sable de terrains de jeu.
Le bois traité à la créosote peut présenter une teneur élevée en HAP, même au bout de plusieurs décennies et des composés phénoliques et hétérocycliques peuvent également être présents. On a mesuré dans ce bois des concentrations moyennes (en mg/kg de bois) allant de 1510 pour la quinoléine à 11 990 pour le phénantrène. Dans des traverses de bois utilisées sur des aires de jeu, on a trouvé des concentrations de BaP pouvant atteindre 1570 mg par kg de copeaux.
Des poissons et des fruits de mer comestibles pêchés dans des zones contaminées par de la créosote ou gardés dans des casiers de bois imprégné de créosote se sont révélés présenter une teneur accrue en HAP et leurs métabolites. La concentration moyenne de BaP dans des queues de homards commercialisées est ainsi passée de 0,6 à 79 μg/kg de poids humide au bout de trois mois en casiers.
Des HAP provenant de la créosote ont été mis en évidence à des concentrations sensiblement plus élevées que les valeurs de fond chez plusieurs groupes d’animaux appartenant à la faune aquatique tels qu’insectes, mollusques, crustacés et poissons capturés sur des sites qui étaient situés dans des eaux douces, estuarielles ou marines contaminées par de la créosote. D’une façon générale, c’est chez les invertébrés que la concentration de ces composés était la plus élevée (jusqu’à plusieurs centaines de mg/kg de poids sec). Dans le foie de poissons vivant dans des eaux où les sédiments étaient contaminés par de la créosote, ainsi que dans l’organisme des invertébrés dont ils se nourrissent, on a relevé, pour les HAP totaux, des concentrations pouvant atteindre respectivement 1 et 84 mg/kg de poids sec (contre respectivement 0,1 et 0,5 mg/kg de poids sec chez les organismes témoins). Chez des gastéropodes (Thais haemastoma) provenant d’une baie à proximité de laquelle se trouvait un atelier d’imprégnation de bois, on a constaté la présence d’hétérocycles à des concentrations allant jusqu’à environ 10 μg/kg de poids humide et la teneur en HAP pouvait atteindre environ 200 μg/kg de poids humide.
C’est en manipulant de la créosote ou des substances qui en contiennent ou encore par contact avec de l’air, de l’eau, de la terre ou des aliments contaminés, que la population générale peut se trouver exposée à ce produit ou à ses constituants. Il existe différentes voies d’exposition comme la voie respiratoire, la voie digestive (boisson ou consommation de nourriture) et la voie cutanée.
En raison de la complexité de ce produit et de la grande diversité des situations dans lesquelles on peut y être exposé, l’exposition peut varier tant qualitativement que quantitativement. Dans le cas de deux scénarios importants, on a néanmoins fait quelques estimations basées sur l’utilisation du BaP comme marqueur et sur un certain nombre d’hypothèses. On a ainsi obtenu une valeur d’environ 2 ng de BaP par kg de poids corporel pour l’exposition journalière par contact cutané d’enfants qui s’amusent dans une aire de jeu équipée de structures en bois traité à la créosote. La dose de BaP ingérée quotidiennement du fait de la consommation de fruits et de légumes cultivés dans des jardins situés aux alentours d’ateliers de créosote a été estimée à 1,4 - 71,4 μg de BaP par kg de poids corporel.
Il existe une étude qui fournit les détails de la surveillance biologique de personnes vivant à proximité d’un atelier d’imprégnation de bois à la créosote. On a ainsi constaté que la quantité de 1- et de 2-naphtol excrétée était sensiblement plus élevée chez les résidants que chez les témoins. Par exemple, la concentration moyenne du 1-naphtol dans les urines du matin était de 2,5 μmol/mol de créatinine chez les personnes exposées et de 1,2 μmol/mol de créatinine chez les sujets non exposés. Il n’y avait pas de différence sensible en ce qui concerne l’excrétion urinaire du 1-pyrénol.
Il peut y avoir exposition professionnelle à la créosote au cours de la fabrication, de l’utilisation, du transport ou de l’élimination du produit ou d’objets en bois traité. La plupart des données disponibles concernent des travailleurs employés au traitement du bois.
La surveillance, selon des méthodes analogues, de la concentration d’aérosols de créosote sous la forme de dérivés volatils issus du brai de goudron de houille dans des ateliers d’imprégnation de bois, a mis en évidence des valeurs pouvant aller jusqu’à 9700 μg/m3. La concentration totale en moyenne pondérée par rapport au temps allait de 0,5 à 9,1 mg/m3 avec des pics à 71 mg/m3 dans des ateliers d’imprégnation de bois et de 0,1 à 11 mg/m3 sur les lieux de travail où l’on manipulait du bois traité à la créosote. La concentration moyenne des HAP liés à des particules allait de 0,2 à 106 μg/m3 dans les ateliers d’imprégnation et de 0,8 à 46 μg/m3 là où des pièces de bois imprégné étaient manipulées. La proportion de HAP liés à des particules par rapport aux HAP totaux s’est révélée inférieure à 4 %.
Les analyses effectuées dans des ateliers d’imprégnation montrent que dans la phase gazeuse, ce sont le naphtalène, les méthylnaphtalènes, l’indène, l’acénaphtène et le fluorène qui prédominent, alors que dans la phase particulaire, on trouve principalement du fluorène, du phénanthrène, de l’anthracène et du pyrène. La concentration maximale de marqueurs comme le naphtalène et le BaP (ce dernier principalement lié à des particules) atteignait respectivement 41 mg/m3 et 1 μg/m3. Parmi les hétérocycles, le benzothiophène était présent en abondance, avec une concentration pouvant atteindre 2800 μg/m3. La concentration du phénol, du biphényle et des méthylstyrènes ne dépassait pas les valeurs respectives de 2000, 1000 et 3000 μg/m3. Des contrôles effectués sur l’air lors de la décontamination de sols fortement pollués par de la créosote ont mis en évidence des concentrations allant jusqu’à 0,9 mg/m3 pour les HAP volatils, 0,2 mg/m3 pour les HAP liés à des particules et inférieures à 0,002 mg/m3 pour le BaP.
La voie cutanée constitue un mode d’exposition professionnelle important à la créosote. On estime que plus de 90 % du pyrène et 50 à 70 % du naphtalène pénètrent dans l’organisme par voie transcutanée. Chez des travailleurs employés à l’imprégnation du bois qui ne portaient pas de vêtements protecteurs, on a relevé une contamination moyenne totale de la peau par le pyrène qui était d’environ 1 mg par jour. Le port de vêtements protecteurs a permis de réduire d’environ 35 % en moyenne la contamination cutanée par le pyrène.
On utilise comme marqueurs biologiques internes de l’exposition à la créosote deux métabolites d’hydrocarbures aromatiques polycycliques, à savoir le 1-naphtol et le 1-pyrénol. Chez des ouvriers finlandais travaillant dans des ateliers d’imprégnation du bois et chez des employés qui assemblaient des éléments en bois traité on a relevé une concentration urinaire moyenne de 1-naphtol respectivement égale à 1350 et 1370 μmol/mol de créatinine. La concentration urinaire moyenne du 1-pyrénol était environ 10 fois plus élevée chez les imprégnateurs (64 μmol/mol de créatinine) que chez les assembleurs. Chez des ouvriers employés à la production de créosote ou à la décontamination de sols pollués par de la créosote, on a constaté une augmentation de la concentration urinaire du 1-pyrénol pendant la durée du poste de travail. Il y avait une bonne corrélation entre la concentration du 1-pyrénol et le degré de contamination cutanée, mais guère de corrélation entre cette concentration et la concentration du pyrène dans l’air de la zone de respiration.
Le calcul de l’exposition basé sur la concentration des métabolites excrétés (et sur les données de surveillance de l’air ou de la contamination cutanée) indiquait que la dose journalière absorbée totale serait comprise entre 15 et 16 mg par travailleur (assembleur ou imprégnateur) dans le cas du naphtalène. En ce qui concerne le pyrène, la dose journalière estimative ne dépassait pas 5 mg par travailleur.
On ne dispose pas d’études sur l’Homme ou sur des animaux de laboratoire au cours desquelles aient été mesurés la vitesse et le taux d’absorption de la créosote de goudron de houille après exposition orale, respiratoire ou cutanée. Toutefois, en recherchant, dans les urines de travailleurs ou de volontaires exposés à la créosote, la présence de métabolites des HAP qu’elle contient, on a pu déterminer si ces constituants avaient été absorbés en proportion significative; une autre méthode a consisté à mettre en évidence la présence d’adduits HAP-ADN dans les tissus d’animaux ou de sujets humains exposés. Les effets toxiques provoqués par la créosote chez des animaux de laboratoire ou des sujets humains constitue aussi une preuve indirecte de l’exposition à ce produit. Par ailleurs, des études portant sur des constituants déterminés montrent que les différents HAP sont susceptibles d’être absorbés en quantité importante, mais elles n’ont qu’une valeur prédictive limitée pour quantifier la cinétique d’absorption après exposition.
On n’a pas fait d’études particulières sur la distribution de la créosote de goudron de houille.
Connaissant les principales voies de métabolisation des HAP, on a dosé leurs métabolites hydroxylés, notamment le 1-naphtol et le 1-pyrénol, dans les urines de sujets humains exposés à la créosote.
D’une façon générale, les HAP (métabolisés ou non) peuvent être excrétés par voie biliaire, fécale ou urinaire ou encore dans le lait maternel, quelle que soit la voie d’absorption. Cela étant, les études consacrées à l’élimination et à l’excrétion de la créosote de goudron de houille se limitent à la recherche et au dosage de leurs métabolites dans l’urine humaine. On a trouvé une concentration élevée de 1-naphtol et de 1-pyrénol dans les urines de travailleurs employés dans plusieurs ateliers d’imprégnation de bois ainsi que dans celles d’ouvriers employés à l’assemblage de pièces de bois traitées par la créosote. En comparant la dose journalière estimative de naphtalène et de pyrène absorbée par la voie respiratoire à la concentration urinaire de 1-naphtol et de 1-pyrénol, on a constaté que d’autres voies que la voie respiratoire contribuaient de façon importante à l’absorption de ces hydrocarbures, en particulier dans le cas du pyrène. On a également observé que la voie d’exposition transcutanée est importante dans le cas du pyrène, car en examinant des ouvriers qui portaient des vêtements protecteurs, on a constaté une diminution sensible de la contamination cutanée et de l’excrétion de 1-pyrénol. L’application topique à des volontaires d’une dose unique de crésosote a provoqué une augmentation sensible de l’excrétion basale de 1-pyrénol.
La demi-vie d’élimination du 1-naphtol et du 1-pyrénol (temps de demi-élimination) est de l’ordre de quelques heures à quelques jours.
La plupart des études consacrées à l’interaction de la créosote avec les constituants cellulaires portent sur son interaction avec les acides nucléiques. On a mis en évidence la présence d’adduits HAP-ADN chez des souris, des rats et des poissons exposés à de la créosote soit expérimentalement, soit dans leur milieu naturel.
Selon des études limitées, les diverses créosotes présentent une toxicité faible à modérée pour les animaux de laboratoire. La valeur la plus faible de la DL50, à savoir 433 mg/kg de poids corporel, a été observée chez des souris après exposition par voie orale. On ne possède pas beaucoup de données fiables au sujet de l’effet des créosotes après une exposition de brève durée. Une perte de poids a été constatée chez des rats, des moutons est des veaux après administration de créosote par la voie orale.
Un certain nombre d’études antérieures, de portée limitée, avaient mis en évidence une activité cancérogène après application topique de diverses créosotes. Les tumeurs observées étaient non seulement des carcinomes est des papillomes cutanés, mais aussi des cancers pulmonaires. Une étude plus récente comportant l’exposition épicutanée de souris à deux préparations différentes de créosote de goudron de houille (préparation No 1 : teneur en BaP égale à 10 mg/kg; préparation No 2 : teneur en BaP égale à 275 mg/kg), a confirmé que la créosote pouvait provoquer des tumeurs cancéreuses cutanées. On a constaté qu’il y avait une relation dose-effet linéaire entre l’incidence de ces tumeurs et la concentration du BaP dans les deux préparations. Les créosotes se sont révélées cinq fois plus actives que ce que l’on pouvait attendre d’un traitement par le seul BaP. Parmi les effets non néoplasiques observés au cours de cette étude à long terme (78 semaines) figuraient des ulcérations cutanées et une diminution de la durée de vie.
Plusieurs créosotes se révèlent irritantes pour la peau chez l’animal. Les données concernant l’irritation de la muqueuse oculaire sont contradictoires.
On ne dispose pas d’expérimentations animales adéquates sur la toxicité des créosotes pour la fonction de reproduction et le développement. On a cependant montré que ces produits pouvaient stimuler des activités à médiation oestrogénique in vitro, ce qui indique une possibilité de perturbation du système endocrine. On a également constaté des effets nocifs sur la reproduction de poissons exposés à la créosote.
Un certain nombre de tests effectués in vitro sur des systèmes bactériens ou mammaliens montrent que la créosote est génotoxique. Le type de génotoxicité observé est analogue à celui des HAP. La créosote se révèle également génotoxique in vivo, comme le montre le test des micronoyaux sur la souris.
Des tests effectués sur des cellules pisciaires en culture révèlent que la cytotoxicité de la créosote est augmentée lorsque les cultures sont soumises à un rayonnement ultraviolet. Cette observation est en accord avec la phototoxicité bien connue de certains HAP.
On a montré que la créosote était capable d’induire les enzymes microsomiennes hépatiques chez les mammifères de laboratoire.
On ne possède guère d’informations concernant les effets de la créosote de goudron de houille sur la population générale.
Il y a eu des cas d’intoxication accidentelle par la créosote dus principalement à l’utilisation de ce produit comme pesticide. La mort est survenue après ingestion d’environ 1 à 2 g (enfants) ou d’environ 7 g de créosote (adultes). Les symptômes consistaient notamment en salivation, vomissements, difficultés respiratoires, vertiges, céphalées, abolition des réflexes pupillaires, hypothermie, cyanose, convulsions, etc. accompagnés de lésions oropharyngées, intestinales, péricardiaques, hépatiques et rénales.
Aux Etats-Unis, on a évoqué de la possibilité d’une augmentation des cas d’érythème cutané chez des personnes habitant dans une ancienne installation d’imprégnation de bois ou à proximité de ce lieu.
En ce qui concerne l’incidence des cancers après exposition environnementale, les données se limitent à une communication faisant état de cas de cancer du sein et de cancers digestifs aux Etats-Unis chez des femmes appartenant à une population exposée à la créosote par la consommation d’eau contaminée. Il n’a toutefois pas été possible de déterminer de façon claire si la créosote était véritablement en cause où si des facteurs de confusion étaient présents.
La plupart des publications relatives aux effets de la créosote de goudron de houille sur l’organisme humain se rapportent à une exposition professionnelle résultant principalement d’un contact cutané ou respiratoire avec de la créosote ou du bois traité par ce produit.
Les effets les plus visibles qui ont été observés consistaient en irritation de la peau et des yeux, avec notamment des réactions phototoxiques et photoallergiques, quelquefois accompagnées de symptômes généraux tels que dépression, faiblesse, céphalées, confusion légère, vertiges, nausées, hypersalivation ou vomissements. Des cas de photosensibilisation (sensibilisation cutanée aux UV par la créosote) ont été observés chez des travailleurs exposés à la créosote.
Dans des cohortes d’ouvriers suédois et finlandais employés à l’imprégnation de pièces de bois avec de la créosote ainsi que chez des travailleurs utilisant du bois d’oeuvre en rondins, on a constaté une augmentation du risque de cancer de la lèvre et de la peau. Les interactions possibles avec l’exposition à la lumière solaire n’ont pas été suffisamment examinées. Chez des briquettiers exposés à la créosote, on a observé une augmentation de la mortalité par cancer du scrotum.
Selon certaines études épidémiologiques, l’exposition à la créosote pourrait aussi comporter un risque de cancer de la vessie, de myélome multiple et de cancer du poumon. Deux études cas-témoins évoquent également la possibilité d’un risque accru de tumeurs cérébrales et de neuroblastomes dans la descendance de travailleurs de sexe masculin ayant pu être exposés à la créosote.
Toutes ces études épidémiologiques se fondent sur une estimation quantitative de l’exposition plutôt que sur sa mesure.
Diverses créosotes de goudron de houille (en solution dans l’acétone) soumises au test Microtox (inhibition de la bioluminescence de Photobacterium phosphoreum ou de Vibrio fischeri) ont donné des valeurs de la CE50 à 15 minutes allant de 0,38 à 0,63 mg/litre. On a également observé une diminution significative de la bioluminescence par rapport aux témoins avec plusieurs échantillons prélevés dans des environnements contaminés par la créosote, comme des sédiments (y compris leurs élutriats et l’eau des pores) ou des eaux souterraines. On a en outre observé une forte inhibition de la nitrification en présence de lixiviats contaminés par la créosote.
La créosote a provoqué l’apparition de signes de stress et une croissance anormale chez des plantes aquatiques exposées expérimentalement. Chez Myriophyllum spicatum, on pouvait constater visuellement les anomalies à des concentrations de créosote ne dépassant pas 1,5 mg/litre. Les valeurs de la CE50 pour des anomalies telles que la diminution de la formation de noeuds, de la longueur des pousses et du poids à sec ont été respectivement estimées à 86, 55 et 33 mg/litre. En outre, à des concentration de créosote allant de 0,1 à 92 mg/litre, on constatait une augmentation importante et liée à la dose de la fuite ionique transmembranaire. Le pouvoir photoxique de la créosote a été mis en évidence chez Lemna gibba : les valeurs nominales de la CE50 pour une réduction du taux de croissance sont passées de 54 mg/litre (au laboratoire, en lumière visible), à 12 mg/litre sous rayonnement solaire simulé.
La mesure de la CE50 et de la CL50 pour les invertébrés aquatique a donné des résultats qui se situent entre 0,02 et 4,3 mg/litre. Les stades larvaires se sont révélés plus sensibles que les stades adultes. L’exposition de daphnies (Daphnia pulex) pendant toute la durée de leur vie à des fractions hydrosolubles de créosote a entraîné une diminution du taux de croissance et une perturbation de la reproduction.
On a observé une augmentation de la sensibilité aux infections chez des huîtres de la côte est (Crassostrea virginica) exposées à des dilutions à 15 % et 30 % de sédiments contaminés par de la créosote. Une mortalité accrue a également été constatée chez de nombreuses espèces de crustacés exposés en laboratoire à des matrices contaminées dans l’environnement par de la créosote. Des effets sublétaux, tels qu’une diminution du gain de poids à sec et de la proportion de femelles gravides ont été observés chez le crustacé Mysidopsis bahia; la CE50 à 7 jours pour ces effets plus subtils correspondait à 0,015 μg d’hydrocarbures aromatiques totaux identifiés par litre.
Des extraits acétoniques de sédiments contaminés par de la créosote présentaient, pour le crustacé Nitocra spinipes, une toxicité aiguë comparable à celle de la créosote elle-même.
La créosote provoque des intoxications aiguës chez les poissons, la valeur la plus faible de la CL50 qui ait été rapportée étant égale à 0,7 mg/litre.
On a montré que des eaux souterraines, des eaux de surface ou des sédiments (y compris l’eau qu’ils contenaient) contaminés par de la créosote, produisait des effets nocifs sur la reproduction et le développement des poissons. On a calculé que la CL50 relative au taux de succès des éclosions était de 0,05 mg de créosote par litre. Chez le tambour croca, Leiostomus xanthurus, la CL50 a diminué à mesure qu’augmentait la durée d’exposition à des sédiments contaminés par de la créosote, sur une durée totale d’exposition de 7 à 28 jours.
Les données relatives aux effets de la créosote sur les organismes terrestres sont limitées. Un test d’allongement de l’appareil racinaire utilisant diverses créosotes et Allium cepa a donné pour la CE50 à 96 h (réduction de la longueur de l’appareil racinaire) des valeurs allant de 18 à 34 mg/litre. Des lombrics (Eisenia foetida) exposés à de la terre contaminée par la créosote (environ 1000 mg de HAP totaux par kg de poids sec) sont morts en quelques jours.
Au voisinage de sources de créosote, on a observé des effets nocifs sur les microorganismes et les invertébrés aquatiques ainsi que sur les poissons, effets qui étaient analogues à ceux que l’on peut produire en laboratoire avec ce produit. Chez des poissons provenant de sites fortement contaminés par la créosote (sédiments), on a observé une forte prévalence de néoplasmes hépatiques et extrahépatiques, un affaiblissement du système immunitaire (réduction de l’activité des macrophages) et une perturbation de la fonction de reproduction.
Lors d’une série d’études en extérieur sur des microécosystèmes aquatiques dans lesquels on avait introduit de la créosote, on a constaté une diminution rapide, fonction de la dose, de l’abondance du zooplancton et du nombre de taxons, avec une CE50 à 5 jours de 45 μg de crιosote par litre (valeur nominale). En revanche, aucun effet nocif direct n’a été constaté sur le phytoplancton. Dans une autre expérience, on a pu observer la mort en 3 jours de truites arc-en-ciel (Oncorhynchus mykiss) exposées à une concentration de créosote de 100 μg/litre (valeur nominale). A plus faible concentration, des anomalies immunologiques ont fait leur apparition en l’espace de 28 jours (concentration la plus faible provoquant un effet observable ou LOEC : 17 μg de crιosote par litre (valeur nominale)). L’immunomodulation provoquée par la créosote régressait pendant l’exposition. Aux concentrations de 3 et de 10 μl de créosote par litre (valeur nominale), des lésions oculaires dépendant de la concentration et une élévation de l’éthoxyrésorufine-O-déséthylase (EROD) hépatique ont été observées.
Les observations sur le terrain portant sur des organismes terrestres concernent des cas mortels d’intoxication d’animaux sauvages (rhinocéros noir Diceros bicornis) et d’animaux de ferme qui pourraient mettre en cause la créosote, ces animaux ayant eu accès, pour l’essentiel, à des objets de bois fraîchement imprégnés ou à des récipients de créosote.
La créosote est une substance cancérogène génotoxique dont on n’a pas mis en évidence le seuil d’activité. Les études sur l’Homme fournissent des données concordantes selon lesquelles ce produit provoque des cancers, mais elles ne permettent pas de procéder à une analyse de la relation dose-réponse.
On a cherché à déterminer l’aptitude de deux échantillons de créosote de goudron de houille à provoquer des cancers de la peau. Deux échantillons de ce produit de teneur différente en BaP ainsi qu’un échantillon de BaP seul appliqués sur la peau de souris ont provoqué une augmentation sensible du taux de formation de papillomes et de carcinomes spinocellulaires au point d’application. Les autres organes n’ont toutefois pas été examinés. On a constaté l’existence d’une relation linéaire entre la proportion de tumeurs et la teneur en BaP de la solution de créosote appliquée sur la peau. Il n’y avait aucune donnée permettant de conclure à l’existence d’un seuil pour l’activité cancérogène de ce produit. L’analyse de la relation dose-réponse a permis de déterminer que le facteur de pente était de 4,9 × 10⁻³ tumeurs/animal pour une dose totale de 1 μg de BaP. A la lumiθre de cette étude, qui se fonde sur la teneur en BaP, la créosote apparaît comme environ 5 fois plus cancérogène qu’une solution contenant uniquement du BaP.
En ce qui concerne les sujets humains, les données tirées de la surveillance de ce type d’exposition sont limitées, aussi n’a t-on pas cherché à obtenir une valeur représentative du risque.
On a procédé au dosage de la créosote dans l’air, l’eau, le sol, les sédiments et les biotes. Le devenir des constituants de la créosote dépend en grande partie de leurs propriétés physicochimiques, de celles de la matrice où ils se trouvent, de la présence d’organismes capables dégrader ou d’accumuler ces produits et enfin, des conditions environnementales. La créosote pourrait comporter un risque important pour les êtres vivants lors de déversements ou lorsque le produit est chargé. Les études en laboratoire montrent que la créosote est toxique pour les organismes aquatiques ou terrestres, et des études dans le milieu naturel ont également mis en évidence des effets nocifs en cas d’exposition à ce produit. Pour l’instant, on ne sait pas avec exactitude si les constituants de la créosote peuvent servir d’indicateurs de la contamination de l’environnement par la créosote et de sa toxicité dans ces conditions.
El primer proyecto de este CICAD fue preparado por el Instituto Fraunhofer de Toxicología y Medicina Experimental de Hannover (Alemania).6 Se realizó una búsqueda bibliográfica amplia en las bases de datos pertinentes en junio de 2002. El primer proyecto de este documento se distribuyó para un examen colegiado limitado y se convocó un Grupo Consultivo a fin de ultimar el documento y verificar la idoneidad de las observaciones del examen colegiado. La lista de los miembros del Grupo Consultivo que participaron en dicho examen colegiado figura en el apéndice 2. El proyecto final se envió luego a los puntos de contacto del IPCS y a las instituciones participantes en él para su examen colegiado, así como a otros expertos identificados en colaboración con el Grupo de Orientación del IPCS sobre Evaluación del Riesgo. La información sobre el examen colegiado de este CICAD aparece en el apéndice 3. Este CICAD se aprobó como evaluación internacional en una reunión de la Junta de Evaluación Final, celebrada en Varna (Bulgaria) del 8 al 11 de septiembre de 2003. La lista de los miembros de la Junta de Evaluación Final figura en el apéndice 4. También se reproduce en este documento la Ficha internacional de seguridad química (ICSC 0572) para la creosota, preparada por el Programa Internacional de Seguridad de las Sustancias Químicas (IPCS, 2002).
Este CICAD se refiere a la creosota de alquitrán de hulla. La creosota de madera es un producto diferente, que se utiliza sobre todo en preparaciones farmacéuticas, y queda fuera del ámbito del presente documento.
La creosota de alquitrán de hulla es un líquido oleoso de color entre pardo y negro o entre amarillento y verde oscuro con un olor característico, que se obtiene por destilación fraccionada de alquitranes de hulla brutos. La temperatura aproximada de la destilación es de 200 °C a 400 °C. Su composición química depende del origen de la hulla y también de las características del proceso de destilación; por consiguiente, los componentes de la creosota raramente son uniformes en cuanto a su tipo y concentración.
La creosota es una mezcla de varios cientos de productos químicos, probablemente mil, pero sólo hay un número limitado de ellos en cantidades superiores al 1%. En su composición hay seis clases principales de compuestos: hidrocarburos aromáticos, en particular hidrocarburos aromáticos policíclicos (PAH) y PAH alquilados (que pueden representar hasta el 90% del total); ácidos/fenoles de alquitrán; heterociclos con bases de alquitrán/nitrógeno; aminas aromáticas; heterociclos con azufre; y heterociclos con oxígeno, incluidos los dibenzofuranos. La creosota se vende como preparaciones diluidas, que pueden contener aceite o disolventes de relleno. Su composición y uso están reglamentados en algunos países; la reglamentación normalmente se concentra en el contenido de benzo[a]pireno (BaP) y de fenoles.
La creosota es sólo ligeramente soluble en agua y soluble en diversos disolventes orgánicos. Sin embargo, las propiedades físicas y químicas de cada uno de sus componentes varían ampliamente; algunos, por ejemplo, son muy solubles en agua.
El análisis de la creosota es complejo. En las diferentes matrices se observan perfiles distintos de sus compuestos: los más volátiles se encuentran en el aire, los más solubles en el agua y los de mayor capacidad de sorción en el sedimento/suelo. En función de la matriz (por ejemplo, aire, agua, suelo/sedimento, materiales biológicos) de la que se toma la muestra, hay que realizar un proceso de limpieza y extracción adecuados. Los métodos de separación y determinación más utilizados son la cromatografía de gases de alta resolución con un detector de ionización de llama o la detección mediante espectrometría de masas o bien la cromatografía líquida de alto rendimiento de fase inversa con un detector de fluorescencia.
Ya se había vigilado la exposición ocupacional a las partículas de creosota suspendidas en el aire en forma de productos volátiles de brea de alquitrán de hulla. Sin embargo, el método de detección de estas partículas no es suficientemente sensible para medir concentraciones bajas de humo de creosota. Se puede realizar un muestreo de los componentes importantes, como los PAH suspendidos en el aire, mediante un filtro de politetrafluoroetileno conectado a un tubo absorbente y analizarlos tras su extracción por cromatografía de gases de alta resolución o cromatografía líquida de alto rendimiento. Se puede hacer un muestreo de otros componentes volátiles de la creosota en tubos absorbentes.
En la evaluación de la exposición a la creosota se han utilizado los metabolitos urinarios de los PAH, 1- pirenol (1-hidroxipireno) y 1-naftol (1-hidroxinaftaleno).
La creosota de alquitrán de hulla es un conservante de la madera y un agente impermeabilizante de estructuras en tierra y en aguas marinas y dulces, así como de traviesas de ferrocarril de distintos tipos, plataformas de puentes y muelles, postes, casas de madera, vallas y equipo para campos de juegos para niños.
La mayor parte de la creosota utilizada en la Unión Europea se destina a la impregnación de la madera a presión. En los Estados Unidos y otros muchos países el uso de la creosota de alquitrán de hulla está limitado a aplicadores certificados.
Los usos en productos distintos de la madera incluyen aplicaciones antiincrustantes en pilotes marinos de hormigón. La creosota puede ser un componente de la brea para techar, el petróleo combustible, el negro de humo y un lubricante para troqueles. Otros usos notificados son como repelente de aves y de otros animales, insecticida, baño antiparasitario para animales y fungicida.
La producción de creosota en los Estados Unidos se divide en dos categorías: destilada (100%) y en solución de alquitrán de hulla. La producción destilada en 1992 fue de 240 000 toneladas y en solución de alquitrán de hulla de 110 000 toneladas. La producción de creosota en la Unión Europea se ha estimado en unas 60 000-100 000 toneladas al año.
Durante la impregnación de los productos de la madera a presión, se puede liberar de los productos tratados el exceso de creosota. Ha sido frecuente la lixiviación de los desechos vertidos en estos lugares de aplicación. La creosota también puede pasar al medio ambiente a partir de las instalaciones mediante emisiones al aire.
El transporte y distribución de la creosota en el medio ambiente es un proceso complejo que depende de las propiedades fisicoquímicas de los componentes que la integran y de su interacción con las propiedades de la matriz, así como de las condiciones ambientales. En general, la creosota se distribuye en todos los compartimentos del medio ambiente (aire, agua, sedimento, suelo, biota). Sin embargo, los destinos principales de sus componentes en el medio ambiente son el sedimento, el suelo y las aguas freáticas.
Por lo general, los compuestos fenólicos, los PAH de bajo peso molecular y algunos heterociclos tienden a localizarse de manera predominante en la fase gaseosa. También se pueden encontrar en la atmósfera elementos constitutivos de la creosota como partículas en suspensión.
La volatilización de la creosota de las aguas superficiales no se considera un proceso significativo.
La circulación de la creosota en los sistemas acuáticos depende de la solubilidad acuosa, la afinidad por las fases orgánicas y la capacidad de sorción de los componentes. En general, la fracción altamente soluble comprende compuestos fenólicos y heterocíclicos, así como PAH de bajo peso molecular. Los compuestos aromáticos de peso molecular elevado, de solubilidad relativamente baja y con capacidad de adsorción alta predominan en los sedimentos asociados. Sin embargo, se puede producir un desplazamiento de compuestos de peso molecular alto debido a su transporte junto con contaminantes presentes en los coloides.
En observaciones sobre el terreno y experimentos de lixiviación en el laboratorio se han puesto de manifiesto pérdidas de componentes de la creosota a partir de construcciones de madera tratada con este producto durante la inmersión en agua. La capacidad de lixiviación de los componentes de la creosota era mayor en el agua dulce que en el agua marina. La velocidad de migración aumenta con la temperatura y disminuye con la antigüedad de los pilotes. La lixiviación de los heterociclos que contienen nitrógeno es más rápida que la de los PAH y la del dibenzofurano.
La velocidad del transporte vertical u horizontal de los componentes de la creosota en el suelo depende de sus propiedades fisicoquímicas, así como de las propiedades del suelo y de las condiciones medioambientales. En experimentos con modelos de laboratorio y sobre el terreno (simulando derrames de creosota) se observó un retraso elevado del transporte de los compuestos de peso molecular bajo. Algunos de los compuestos de la creosota desprendidos de los productos de la madera hacia el suelo circundante pueden persistir durante decenios.
Las plantas y los animales terrestres solamente absorben en pequeña medida los PAH de la creosota. No se dispone de datos cuantitativos sobre la absorción de compuestos de creosota por los animales de granja. Algunos invertebrados acuáticos y peces vigilados sobre el terreno y en estudios de laboratorio mostraron una absorción importante de PAH derivados de la creosota. Es posible la transferencia al suministro de alimentos humanos mediante el pescado y el marisco contaminados.
La biodegradabilidad de los elementos constitutivos de la creosota es variable. En general, la eficacia de la degradación aerobia es mayor que la de la anaerobia. La degradación de los compuestos fenólicos es relativamente fácil. Dentro de los PAH, la degradabilidad parece ser inversamente proporcional al número de anillos aromáticos. Algunos compuestos heteroaromáticos se eliminan con rapidez, mientras que otros son más persistentes. Parece que la biotransformación de los componentes de la creosota predomina sobre la mineralización. En algunos casos, los intermediarios formados pueden ser más persistentes, móviles o tóxicos que los compuestos de los que proceden.
Además de las características estructurales de los productos químicos, en su degradación o transformación in situ influyen algunos otros factores, como la biodisponibilidad, la adaptación microbiana, el suministro de oxígeno y la disponibilidad de nutrientes.
Aunque se ha examinado poco este aspecto, parece que los peces metabolizan los PAH de la creosota con mayor rapidez que los invertebrados acuáticos.
La transformación fotoquímica parece ser el mecanismo abiótico más importante mediante el cual algunos constituyentes de la creosota, como los PAH y los compuestos heterocíclicos y fenólicos, se transforman en la atmósfera y, en menor grado, en el agua y el suelo. La fotooxidación predomina sobre la fotolisis directa. En un estudio de irradiación de determinados PAH por separado o de los mismos presentes en una mezcla de creosotas se puso de manifiesto la tendencia hacia una disminución de la fotorreactividad en la mezcla en comparación con las pruebas individuales.
En los invertebrados acuáticos y los peces se produce una bioacumulación de componentes de la creosota, como se ha demostrado sobre todo para los PAH mediante estudios de vigilancia sobre el terreno de zonas contaminadas por creosota, experimentos de relocalización y estudios de laboratorio o de microcosmos. En general, los perfiles de los PAH en los insectos y los cangrejos de río suelen ser semejantes a los observados en los sedimentos, mientras que los peces tenían valores muy alterados de la razón entre los PAH de peso molecular bajo y de peso molecular alto. Raramente se han notificado factores de bioconcentración en relación con la exposición a la creosota. Sin embargo, se ha estimado que los factores de bioconcentración para los componentes de los PAH procedentes de sedimentos contaminados por creosota oscilan entre 0,3 y 73 000.
Se han elaborado diversas estrategias de corrección, principalmente para las aguas freáticas y los suelos contaminados por creosota. La mayor parte de los tratamientos lograron reducciones significativas de determinadas sustancias, pero la reducción del potencial tóxico de las matrices tratadas tuvo un éxito nulo o sólo parcial.
La madera tratada con creosota no se descompone en el medio ambiente, por lo que su eliminación es problemática. Dicha madera no se debe incinerar en condiciones no controladas, dado que se pueden producir sustancias tóxicas, como PAH y dioxinas halogenadas y furanos.
Los muy escasos datos disponibles para las concentraciones en el aire ambiente se refieren a las de determinados PAH en las cercanías de instalaciones de creosota. Se ha notificado para el naftaleno una concentración máxima de 90 ng/m3 a una distancia de 2000 m. Las concentraciones decrecían al aumentar la distancia de las instalaciones de tratamiento con creosota: por ejemplo, de 64 ng/m3 a 500 m a 1,6 ng/m3 a 5000 m para el fluoranteno o de 5 ng/m3 a 100 m a 0,6 ng/m3 a 2000 m para el BaP.
Se ha comprobado que las muestras de agua freática recogidas cerca de vertederos de creosota en diversos países contienen PAH y compuestos fenólicos, heterocíclicos y de BTEX (benceno, tolueno, etilbenceno y xileno). Los datos de vigilancia de 44 vertederos de creosota daneses pusieron de manifiesto concentraciones (percentil 90) de 30 µg/l para el BaP y 50 µg/l para el criseno. Las concentraciones más elevadas de varios compuestos heterocíclicos, fenólicos o de BTEX por separado detectadas en las inmediaciones de varios vertederos de creosota eran del orden de 10-80 mg/l.
Se encontraron concentraciones de algunos mg/l para determinados PAH en aguas de río afectadas por un derrame de creosota que se había producido 10 años antes. Se vigilaron 12 PAH por separado en muestras de agua de una corriente de drenaje cercana a zonas de trabajo con creosota. Las concentraciones máximas fueron de 0,02 µg/l (benzo[b]fluoranteno y benzo[k]fluoranteno) a 153 µg/l (naftaleno), con concentraciones de BaP de hasta 0,05 µg/l.
Se han observado asimismo concentraciones elevadas de PAH en pequeñas corrientes de agua cuyos taludes estaban protegidos por estructuras de madera tratada con creosota o en zanjas localizadas junto a las vías de ferrocarril, donde se instalaban postes de madera tratada con creosota para las líneas de energía eléctrica o de telecomunicaciones. La concentración máxima de BaP medida fue de 2,5 µg/l. La concentración total media de PAH en las zanjas fue de unos 600 µg/l.
En las proximidades de instalaciones de protección de la madera, la concentración máxima para el total de los PAH presentes en los sedimentos ascendió a unos 20 000-30 000 mg/kg de peso seco; la concentración máxima para el total de los heterociclos de nitrógeno fue del orden de 1000 mg/kg de peso seco. Se han medido concentraciones de BaP de hasta varios cientos de mg/kg de peso seco. El heterociclo más abundante era el carbazol (18 mg/kg de peso seco). En los sedimentos cercanos a construcciones de madera tratada con creosota (pilares, protección de taludes, postes/traviesas) se detectaron concentraciones totales de PAH de hasta 1200 mg/kg de peso seco, con una concentración media de BaP de unos 2 mg/kg de peso seco.
Se han documentado concentraciones elevadas de compuestos derivados de la creosota en suelos cercanos a instalaciones abandonadas de producción/utilización de creosota en varios países, con concentraciones máximas de varios miles de mg/kg de peso seco para la concentración total de PAH y de casi 100 mg/kg para los fenoles totales. Se han notificado concentraciones de "contenido de aceite de creosota" de hasta 90 000 mg/kg de peso seco alrededor de postes tratados. El suelo de una zona de almacenamiento de traviesas de ferrocarril impregnadas o la arena de campos de juegos delimitados por viejas traviesas de ferrocarril tratadas contenían una concentración total de PAH de hasta 20 mg/kg o hasta unos 2 mg/kg de peso seco, respectivamente. Las concentraciones de BaP presentes en suelos cercanos a lugares de tratamiento/almacenamiento de madera alcanzaron un máximo de 390 mg/kg de peso seco, las obtenidas cerca de postes tratados con creosota 6 mg/kg y las de la arena de campos de juego 0,2 mg/kg.
Los productos de madera impregnada con creosota pueden contener concentraciones elevadas de PAH, incluso después de varios decenios de uso; también pueden estar presentes compuestos fenólicos y heterocíclicos. Por ejemplo, se ha observado que las concentraciones medias (mg/kg de madera) en la madera tratada con creosota oscilan entre 1510 (quinolina) y 11 990 (fenantreno). Las traviesas de madera instaladas en campos de juegos mostraban concentraciones de BaP de hasta 1570 mg/kg de virutas.
Se ha observado que el pescado y el marisco comestibles capturados en zonas contaminadas por creosota o mantenidos en jaulas tratadas con este producto contenían concentraciones más elevadas de PAH y sus metabolitos. La concentración media de BaP en la carne de la cola de las langostas de los mercados comerciales aumentaba de 0,6 a 79 µg/kg de peso húmedo tras unos tres meses de estar enjauladas.
Se han detectado PAH derivados de la creosota en concentraciones significativamente superiores a los niveles de fondo en diversas clases de fauna acuática, con inclusión de insectos, moluscos, crustáceos y peces recogidos en varios lugares contaminados por creosota en entornos de agua dulce o de estuarios/marinos. En general, las concentraciones eran más elevadas en los invertebrados (hasta de varios cientos de mg/kg de peso seco). Las concentraciones del total de PAH en el hígado de los peces que vivían en sedimentos contaminados por creosota y en los organismos invertebrados que les servían de alimento eran de hasta 1 y 84 mg/kg de peso seco, respectivamente (en comparación con 0,1 y 0,5 mg/kg de peso seco en los testigos). Se observó la presencia de compuestos heterocíclicos en los caracoles (Thais haemastoma) procedentes de una bahía cercana a una instalación de protección de la madera en concentraciones de hasta unos 10 µg/kg de peso húmedo y de PAH en concentraciones de hasta unos 200 µg/kg de peso húmedo.
Puede haber exposición de la población general a la creosota o sus componentes mediante la manipulación de ésta o de los productos que la contienen o por contacto con el aire, el agua, el suelo o los alimentos contaminados por creosota. Las vías de exposición son la inhalación, la bebida/ingestión y el contacto cutáneo.
Debido a la complejidad de la creosota y a las numerosas situaciones de exposición diferentes, dicha exposición puede variar tanto cualitativa como cuantitativamente. No obstante, se han realizado algunas estimaciones para dos hipótesis importantes de exposición utilizando BaP como sustancia marcadora y tomando como base varias premisas. En consecuencia, se ha evaluado una exposición diaria por contacto cutáneo de unos 2 ng de BaP/kg de peso corporal en niños que juegan en campos cuyo material está tratado con esta sustancia. La ingesta diaria de BaP a partir del consumo de hortalizas y frutas procedentes de huertos próximos a instalaciones de producción de creosota se ha estimado que es del orden de 1,4 a 71,4 µg/kg de peso corporal.
Hay un estudio que proporciona datos de vigilancia interna de las personas que viven en las inmediaciones de una instalación de impregnación de creosota. Los valores de excreción del 1- y 2-naftol fueron significativamente superiores en los residentes expuestos que en los testigos. Por ejemplo, las concentraciones medias de 1-naftol en las muestras de orina tomadas por la mañana fueron de 2,5 µmoles/mol de creatinina para el grupo expuesto y de 1,2 µmoles/mol de creatinina para el no expuesto. La excreción de 1-pirenol no difería de manera significativa.
Se puede producir exposición ocupacional a la creosota durante su fabricación, uso, transporte o eliminación o la de los productos de madera tratados con ella. La mayor parte de los datos disponibles son de personas que trabajan en la protección de la madera.
Las concentraciones de aerosoles de creosota controlados como productos volátiles de brea de alquitrán de hulla por métodos similares en instalaciones de impregnación de la madera alcanzaron valores máximos de hasta 9700 µg/m3. El promedio total ponderado por el tiempo de las concentraciones de vapores de creosota variaban entre 0,5 y 9,1 mg/m3, con máximos de hasta 71 mg/m3, en instalaciones de impregnación de la madera y entre 0,1 y 11 mg/m3 en los lugares de trabajo donde se manipulaba madera tratada. Las concentraciones medias de PAH en forma de partículas oscilaban entre 0,2 y 106 µg/m3 en las instalaciones de impregnación y entre 0,8 y 46 µg/m3 en la manipulación de la madera impregnada. La proporción de PAH unidos a partículas en relación con la total parecía ser inferior al 4%.
Los compuestos predominantes de la fase de vapor de las instalaciones de impregnación de la madera eran el naftaleno, los metilnaftalenos, el indeno, el acenafteno y el fluoreno; los principales PAH de la fase particulada eran el fluoreno, el fenantreno, el antraceno y el pireno. Las concentraciones máximas de las sustancias marcadoras, como el naftaleno y el BaP (este último fundamentalmente unido a partículas) eran de hasta 41 mg/m3 y 1 µg/m3, respectivamente. Un PAH heterocíclico abundante era el benzotiofeno, con concentraciones de hasta 2800 µg/m3. Las concentraciones de fenil, bifenil y metil estirenos no excedían de 2000, 1000 y 3000 µg/m3, respectivamente. En la vigilancia del aire durante las operaciones de limpieza de suelos muy contaminados por creosota se detectaron concentraciones de exposición de hasta 0,9 mg/m3 para los PAH volátiles, 0,2 mg/m3 para los PAH particulados y < 0,002 mg/m3 para los BaP.
Una vía importante de exposición profesional a la creosota es la cutánea. Se ha estimado que más del 90% del pireno y entre el 50 y el 70% del naftaleno penetran por esta vía. La concentración total media de pireno sobre la piel de los trabajadores de la impregnación con creosota era de aproximadamente 1 mg/día en los trabajadores sin ropa de protección. La ropa de protección reducía la contaminación cutánea por pireno de los trabajadores de la impregnación como promedio alrededor de un 35% .
Se ha vigilado la concentración de dos metabolitos de los PAH, el 1-naftol y el 1-pirenol, como marcadores internos de la exposición a la creosota. Por ejemplo, la concentración urinaria media de 1-naftol en los trabajadores finlandeses de instalaciones de impregnación de la madera y en ensambladores que manejaban madera tratada era de 1350 y 1370 µmoles/mol de creatinina, respectivamente. La concentración urinaria media de 1-pirenol era en estos impregnadores de la madera unas 10 veces superior (64 µmoles/mol de creatinina) a la de los ensambladores. También se ha observado un aumento de los valores de 1-pirenol en la orina durante el turno de trabajo en trabajadores que intervenían en la producción de creosota o la limpieza de suelos contaminados por ella. Había una correlación elevada de las concentraciones de 1-pirenol con las diferencias en la contaminación cutánea por pireno, pero baja con las diferencias en las concentraciones de pireno en el aire de zonas en las que se respiraba.
Los cálculos de la exposición basados en los metabolitos excretados (más los datos de vigilancia del aire y/o la piel) parecen indicar una absorción diaria de 15 ó 16 mg/trabajador (ensamblador o impregnador) para el naftaleno. Las estimaciones para el pireno no sobrepasaban los 5 mg/trabajador al día.
No hay ningún estudio en animales de laboratorio o en personas que mida la velocidad específica y la magnitud de la absorción de creosota de alquitrán de hulla tras la exposición oral, respiratoria o cutánea. Sin embargo, hay pruebas de una absorción importante de componentes de la creosota gracias a la detección de metabolitos de los PAH de la creosota en la orina de trabajadores o voluntarios expuestos a esta sustancia y la detección de aductos de PAH-ADN en tejidos animales o humanos tras la exposición a ella. También hay pruebas indirectas derivadas de los efectos tóxicos originados por la creosota en animales de laboratorio o en personas. Además, los estudios sobre componentes aislados ponen de manifiesto un potencial de absorción importante de los distintos PAH, aunque su valor predictivo para la cinética de la absorción cuantitativa tras la exposición a la mezcla sea limitado.
No se han realizado estudios específicos de distribución para la creosota de alquitrán de hulla.
Con arreglo a las principales vías metabólicas de los PAH se han medido algunos de sus hidroximetabolitos, por ejemplo el 1-naftol y el 1-pirenol, en la orina de personas expuestas a la creosota.
En general, los PAH (metabolizados o no) se pueden excretar en la bilis, las heces y la orina, así como en la leche materna, con independencia de la vía de absorción. Sin embargo, los estudios específicos sobre la eliminación y excreción de la creosota de alquitrán de hulla se han limitado a la determinación de los metabolitos de los PAH en la orina humana. Se han detectado niveles urinarios elevados de 1-naftol y 1-pirenol en trabajadores de varias instalaciones de tratamiento de la madera con creosota y en ensambladores que manipulaban la madera impregnada. Las comparaciones entre la ingesta diaria estimada de naftaleno/pireno por inhalación y la excreción urinaria de 1-naftol/1-pirenol indicaba una notable contribución de las vías de absorción distintas de la inhalación, especialmente para el pireno. Se ha demostrado asimismo la relevancia de la absorción cutánea para la excreción de 1-pirenol en los trabajadores que utilizaban ropa de protección, con la consiguiente reducción significativa de la contaminación cutánea y de la excreción de 1-pirenol. El tratamiento tópico de voluntarios con una dosis única de creosota aumentó considerablemente la excreción basal de 1-pirenol.
Las semividas de eliminación para el 1-naftol y 1-pirenol fueron del orden de horas o días.
La mayor parte de los estudios sobre las interacciones de la creosota con componentes celulares se refieren a interacciones de los PAH de la creosota con los ácidos nucleicos. Se han detectado aductos de PAH-ADN en ratones, ratas y peces tras la exposición experimental o ambiental a la creosota.
De acuerdo con algunos estudios limitados, las creosotas tienen en los animales de experimentación una toxicidad aguda entre baja y moderada. El valor más bajo de la DL50, de 433 mg/kg de peso corporal, se notificó para los ratones tras la exposición oral. Hay poca información fidedigna sobre los efectos de las creosotas tras una exposición breve. Se ha observado pérdida de peso corporal en ratas, ovejas y terneros después del suministro de dosis de creosota por vía oral.
Algunos estudios limitados anteriores con ratones indicaban una actividad carcinogénica de las creosotas tras la aplicación tópica. Los tipos de tumores eran no sólo carcinomas y papilomas cutáneos, sino también carcinomas de pulmón. En un estudio epicutáneo más reciente realizado en ratones con dos preparaciones diferentes de creosota de alquitrán de hulla (CTP1: contenido de BaP de 10 mg/kg; CTP2: contenido de BaP de 275 mg/kg), se confirmó el potencial carcinogénico de las creosotas con respecto a la inducción de tumores cutáneos. Había una relación lineal dosis-efecto entre la incidencia de tumores y el contenido de BaP de ambas creosotas. Las creosotas fueron unas cinco veces más potentes de lo que cabía esperar de los tratamientos con BaP puro. Los efectos no neoplásicos observados en este estudio prolongado (78 semanas) fueron ulceraciones cutáneas y disminución de la longevidad.
Se ha demostrado que varias creosotas son irritantes de la piel en los animales. Los datos sobre la irritación ocular son contradictorios.
No hay ningún estudio adecuado en animales sobre la toxicidad reproductiva o en el desarrollo. Sin embargo, se ha demostrado que la creosota puede desencadenar in vitro actividades mediadas por estrógenos, lo cual indica un cierto potencial de trastorno endocrino. También se han notificado efectos adversos sobre la reproducción en peces expuestos a ella.
Diversas pruebas in vitro basadas en sistemas de bacterias y de mamíferos han puesto de manifiesto que la creosota es genotóxica. La pauta de genotoxicidad observada era similar a la que se producía en los PAH. La creosota fue también genotóxica en una prueba in vivo de micronúcleos en ratones.
Las pruebas realizadas en cultivos de células de peces mostraron que la citotoxicidad de la creosota aumenta mediante la radiación con luz ultravioleta. Esto es coherente con el potencial fototóxico conocido de algunos PAH.
Se ha demostrado que la creosota es inductora de enzimas microsomales hepáticas en mamíferos de laboratorio.
Apenas hay información sobre los efectos de la creosota de alquitrán de hulla en la población general.
Se conocen casos de intoxicación incidental o accidental relacionados con la creosota, principalmente debido a su utilización como plaguicida. Se produjeron fallecimientos tras la ingestión de 1-2 g (niños) o unos 7 g (adultos). Entre los síntomas cabe mencionar salivación, vómitos, dificultades respiratorias, vértigo, dolor de cabeza, pérdida de reflejos pupilares, hipotermia, cianosis, convulsiones, etc., acompañados de daños orofaríngeos, intestinales, pericárdicos, hepáticos y renales.
Se ha indicado en los Estados Unidos una mayor incidencia de erupciones cutáneas en personas residentes en una instalación abandonada de tratamiento de la madera con creosota o cerca de ella.
Las pruebas de incidencia de cáncer tras la exposición ambiental se limitan a un informe sobre casos de cáncer de mama y gastrointestinal en mujeres de una población expuesta a un suministro de agua contaminada por creosota en los Estados Unidos. Sin embargo, no se pudo demostrar claramente si se debía a la creosota o a factores de riesgo de confusión.
La mayoría de los informes sobre los efectos de la creosota de alquitrán de hulla en las personas se refieren a la exposición ocupacional, derivada fundamentalmente del contacto cutáneo y/o por inhalación con creosota o madera tratada con ella.
Los efectos más manifiestos eran irritaciones o lesiones de la piel y los ojos, en particular reacciones fototóxicas o fotoalérgicas, a veces acompañadas de síntomas generales como depresión, debilidad, dolor de cabeza, ligera confusión, vértigo, náuseas, aumento de la salivación o vómitos. Se ha observado fotosensibilización (sensibilización de la piel a la luz ultravioleta mediante la creosota) en trabajadores expuestos a esta sustancia.
En estudios de cohortes de impregnadores de la madera suecos y noruegos y en trabajadores de madera en rollo finlandeses se ha detectado un mayor riesgo de inducción de cáncer de labios y de piel. No se ha estudiado de manera adecuada la posible interacción con la exposición a la luz solar. La mortalidad por cáncer de escroto fue elevada entre los fabricantes de ladrillos expuestos a la creosota.
Algunos estudios epidemiológicos aislados parecen indicar un posible riesgo de cáncer de vejiga, mieloma múltiple y cáncer de pulmón debido a la exposición a la creosota. De dos estudios de casos y testigos se dedujo un aumento del riesgo de tumores cerebrales y neuroblasomas entre la descendencia de trabajadores varones con posible exposición a la creosota.
Todos los estudios epidemiológicos se basaron en estimaciones cualitativas de la exposición más que en mediciones.
Los valores de la CE50 (15 minutos) determinados mediante la prueba Microtox (inhibición de la bioluminiscencia de Photobacterium phosphoreum o Vibrio fischeri) de distintas creosotas de alquitrán de hulla (en soluciones de acetona) fueron de 0,38 a 0,63 mg/l. También se ha observado una disminución significativa de la bioluminiscencia en comparación con los testigos para varias muestras tomadas del medio ambiente contaminadas por creosota, tales como sedimentos (con inclusión de sus elutriados y su agua capilar) y aguas freáticas. Además, se ha detectado una fuerte inhibición de la nitrificación por una solución de lixiviación contaminada por creosota.
La creosota indujo signos de estrés y crecimiento anormal en plantas acuáticas expuestas de manera experimental. Se pudieron observar cambios visuales en Myriophyllum spicatum con concentraciones nominales de creosota de sólo 1,5 mg/l. Se calcularon valores de la CE50 para una disminución de la producción de nudos, la longitud de los tallos y el peso seco de 86, 55 y 33 mg/l, respectivamente. Además, la transferencia de iones a través de la membrana aumentó de manera significativa y dependiente de la dosis para concentraciones de creosota de 0,1 a 92 mg/l. Se ha demostrado el potencial fototóxico en Lemna gibba: los valores de la CE50 (nominal) para la reducción de la tasa de crecimiento disminuyó de 54 mg/l (bajo luz visible de laboratorio) a 12 mg/l en condiciones de radiación solar simulada.
Se han medido en invertebrados acuáticos valores de la CE50/CL50 de la creosota del orden de 0,02-4,3 mg/l. Las fases larvarias resultaron más sensibles que las adultas. La exposición durante toda la vida de Daphnia pulex a fracciones de creosota solubles en agua produjeron una disminución de la tasa de crecimiento y trastornos reproductivos.
Se ha observado un aumento de la susceptibilidad a las infecciones en las ostras orientales (Crassostrea virginica) expuestas a diluciones del 15% y el 30% de sedimento contaminado por creosota. Se ha detectado un aumento de la mortalidad en muchas especies de crustáceos expuestas en el laboratorio a matrices contaminadas en el medio ambiente por creosota. Se han registrado en Mysidopsis bahia (crustáceo) efectos subletales, por ejemplo una disminución del aumento del peso seco y de la proporción de hembras preñadas; la CE50 en siete días para estos efectos más leves fue de 0,015 µg del total de los hidrocarburos aromáticos identificados/l.
Los extractos de acetona de sedimentos contaminados por creosota mostraron una toxicidad aguda para Nitocra spinipes (crustáceo) comparable con la de la creosota.
La creosota tiene toxicidad aguda para los peces, siendo la CL50 más baja notificada de 0,7 mg/l.
Se ha demostrado que el agua freática, el agua o los sedimentos contaminados por creosota (con inclusión de las aguas asociadas) provocan efectos adversos en la reproducción y el desarrollo de los peces. Se calculó que la CL50 para el éxito de la eclosión era de 0,05 mg de creosota/l. Los valores de la CL50 determinados en el verrugato croca (Leiostomus xanthurus) disminuyeron con el aumento de la duración de la exposición a sedimento contaminado por creosota durante 7-28 días de exposición.
Los datos sobre los efectos de la exposición a la creosota en los organismos terrestres son limitados. En una prueba de elongación de las raíces de Allium cepa con distintas creosotas se obtuvieron valores de la CE50 a las 96 horas (para la reducción de la longitud de las raíces) de 18 a 34 mg/l. Las lombrices de tierra (Eisenia foetida) expuestas a suelo contaminado por creosota (por ejemplo, unos 1000 mg de PAH totales/kg de peso seco) murieron a los pocos días.
En las cercanías de fuentes de creosota, se han observado en microorganismos acuáticos, invertebrados acuáticos y peces efectos adversos semejantes a los inducibles por esta sustancia en el laboratorio. Los peces procedentes de lugares muy contaminados por creosota (sedimentos) mostraron una elevada prevalencia de neoplasmas hepáticos y extrahepáticos, trastornos de la situación inmunitaria (reducción de la actividad de los macrófagos) y trastornos de la función reproductiva.
En una serie de estudios de microcosmos acuáticos en el exterior en el que se añadía creosota, hubo una rápida reducción dependiente de la concentración de la abundancia de zooplancton y el número de taxones, con una CE50 (a los cinco días) de 45 µg de creosota/l (nominales). En cambio, no se observaron efectos adversos directos en la comunidad de fitoplancton. En otra prueba, las truchas arco iris (Oncorhynchus mykiss) expuestas a 100 µl de creosota/l (nominales) murieron en tres días. En concentraciones más bajas, aparecieron alteraciones inmunológicas en 28 días (concentración más baja con efectos observados [LOEC]: 17 µl de creosota/l [nominales]). La inmunomodulación inducida por creosota fue reversible durante la exposición continua. Se observaron daños oculares dependientes de la concentración y una elevada actividad de la etoxiresorufin-O-deetilasa hepática con 3 y 10 µl de creosota/l (nominales).
Hay observaciones sobre el terreno en organismos terrestres relativas a casos fatales de posible intoxicación por creosota en la flora y fauna silvestres (rinoceronte negro, Diceros bicornis) y en animales de granja que tenían acceso principalmente a contenedores de madera tratada recientemente con creosota o de creosota.
La creosota es un carcinógeno genotóxico para el que no se ha determinado ningún umbral. Hay pruebas convincentes obtenidas en estudios con personas de que la creosota provoca cáncer de piel, pero con esos estudios no se puede realizar un análisis de la relación dosis-respuesta.
En un estudio en el que se examinó la carcinogenicidad cutánea en ratones de dos muestras de creosota de alquitrán de hulla con distintos contenidos de BaP por una parte y de BaP solo por otra, se registró un aumento significativo de la tasa de formación de papilomas y carcinomas de células escamosas en el punto de la aplicación. Sin embargo, no se examinaron otros órganos. Se observó una relación lineal entre el índice de tumores y la dosis de BaP en la solución de creosota aplicada en la piel. No se encontraron pruebas de un umbral para los efectos carcinogénicos. El análisis de la relación dosis-respuesta dio lugar a un factor de pendiente de 4,9 × 10⁻³ tumores/animal para una dosis total de 1 µg de BaP. En este estudio, basado en su contenido de BaP, la creosota parecía unas cinco veces más carcinogénica que una solución de BaP solo.
Los datos de vigilancia en las personas relativos a este tipo de exposición son limitados; por consiguiente, no se ha incluido aquí una evaluación del riesgo de muestra.
Se ha medido la creosota en el aire, el agua, el suelo, el sedimento y la biota. El destino de los componentes de la creosota depende en gran medida de las propiedades fisicoquímicas de dichos componentes, las propiedades de la matriz, la presencia de organismos que los degradan o acumulan y las condiciones ambientales. La creosota puede plantear un riesgo significativo para la biota cuando se producen derrames o una acumulación. En estudios de laboratorio se ha demostrado la toxicidad de la creosota para los organismos acuáticos y terrestres, mientras que en estudios sobre el terreno se han demostrado asimismo efectos adversos tras la exposición a ella. Hasta el momento no está claro qué componentes de la creosota pueden servir como indicadores de la contaminación y la toxicidad de la creosota en el medio ambiente.
ENDNOTES:
    See Also:
       Toxicological Abbreviations